| Pond | egg.mass | strata |
|---|---|---|
| A | 2 | 1 |
| B | 6 | 1 |
| C | 8 | 1 |
| D | 10 | 2 |
| E | 10 | 2 |
| F | 12 | 2 |
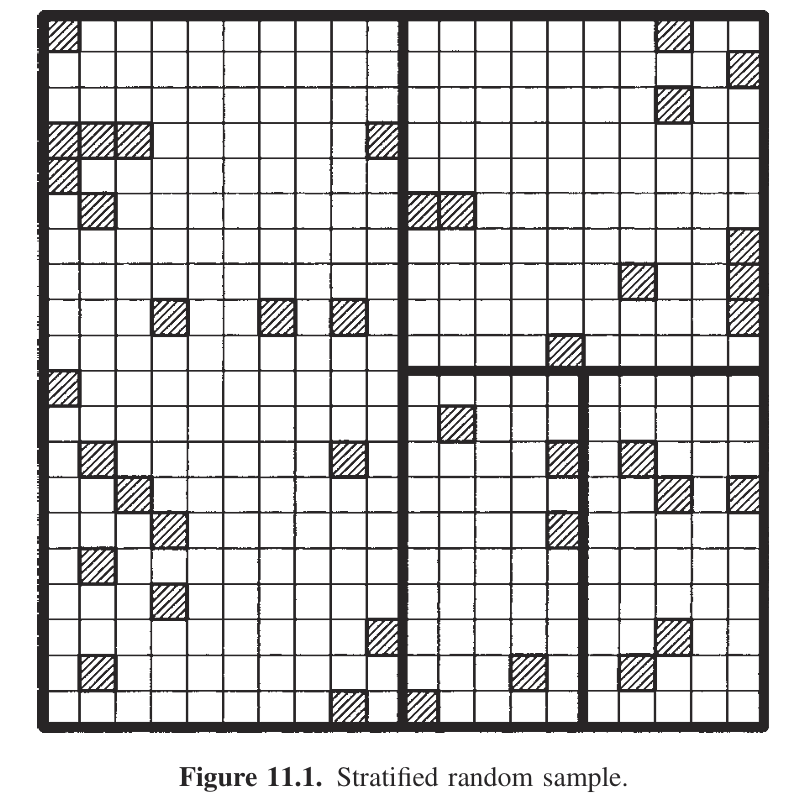
Concept
Can we improve on an unbiased estimator using SRS?
We can improve our parameter variances!
How? Break our sampling frame into homogeneous parts.
Concept
- define strata (singular, stratum)
- randomly sample within ALL strata
- try to create homogenous strata
- ideally a higher sample size within strata with higher variance
Concept
- auxiliary information
- depends on ability to select beneficial strata
- almost always going to improve precision; unlikely to do worse
- allocate more samples to a stratum to lower the overall variance
What are strata used in fish/wildlife studies?
Estimator
We sample \(y_{ih}\) within strata \(h\) from 1 … \(L\) and units \(i\) from 1 … \(n_h\).
\[ \bar{y}_{h} = \hat{\mu}_{h} = \frac{1}{n_h} \sum_{i=1}^{n_h} y_{hi} \]
\[ \hat{\mu}_{st} = \frac{1}{N} \sum_{h=1}^{L} N_{h}\hat{\mu}_{h} \]
Estimator
\[ \hat{\sigma}^2_{\hat{\mu},h} = \frac{1}{n_h -1} \sum_{i=1}^{n_h}\left(y_{hi}-\hat{\mu}_{h}\right)^2 \]
\[ \hat{\sigma}^2_{\hat{\mu},st} = \sum_{h=1}^{L} \left(\frac{N_h}{N}\right)^2 \frac{N_h-n_h}{N_h}\frac{\hat{\sigma}^2_{\hat{\mu},h}}{n_h} \]
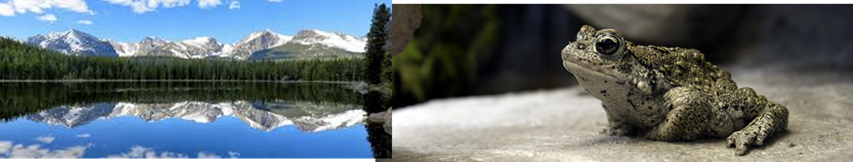
Boreal Toad (Case Study)
Goal: to know the mean number of boreal toad egg masses per pond in RMNP
Goal 2: Use stratification to reduce the sampling variance.
Boreal Toad (Case Study)
- \(N = 6\) ; \(L = 2\)
- \(N_{h} = N/L = 3\)
- \(n_{h} = 2\)
- \(\mu = 8\)
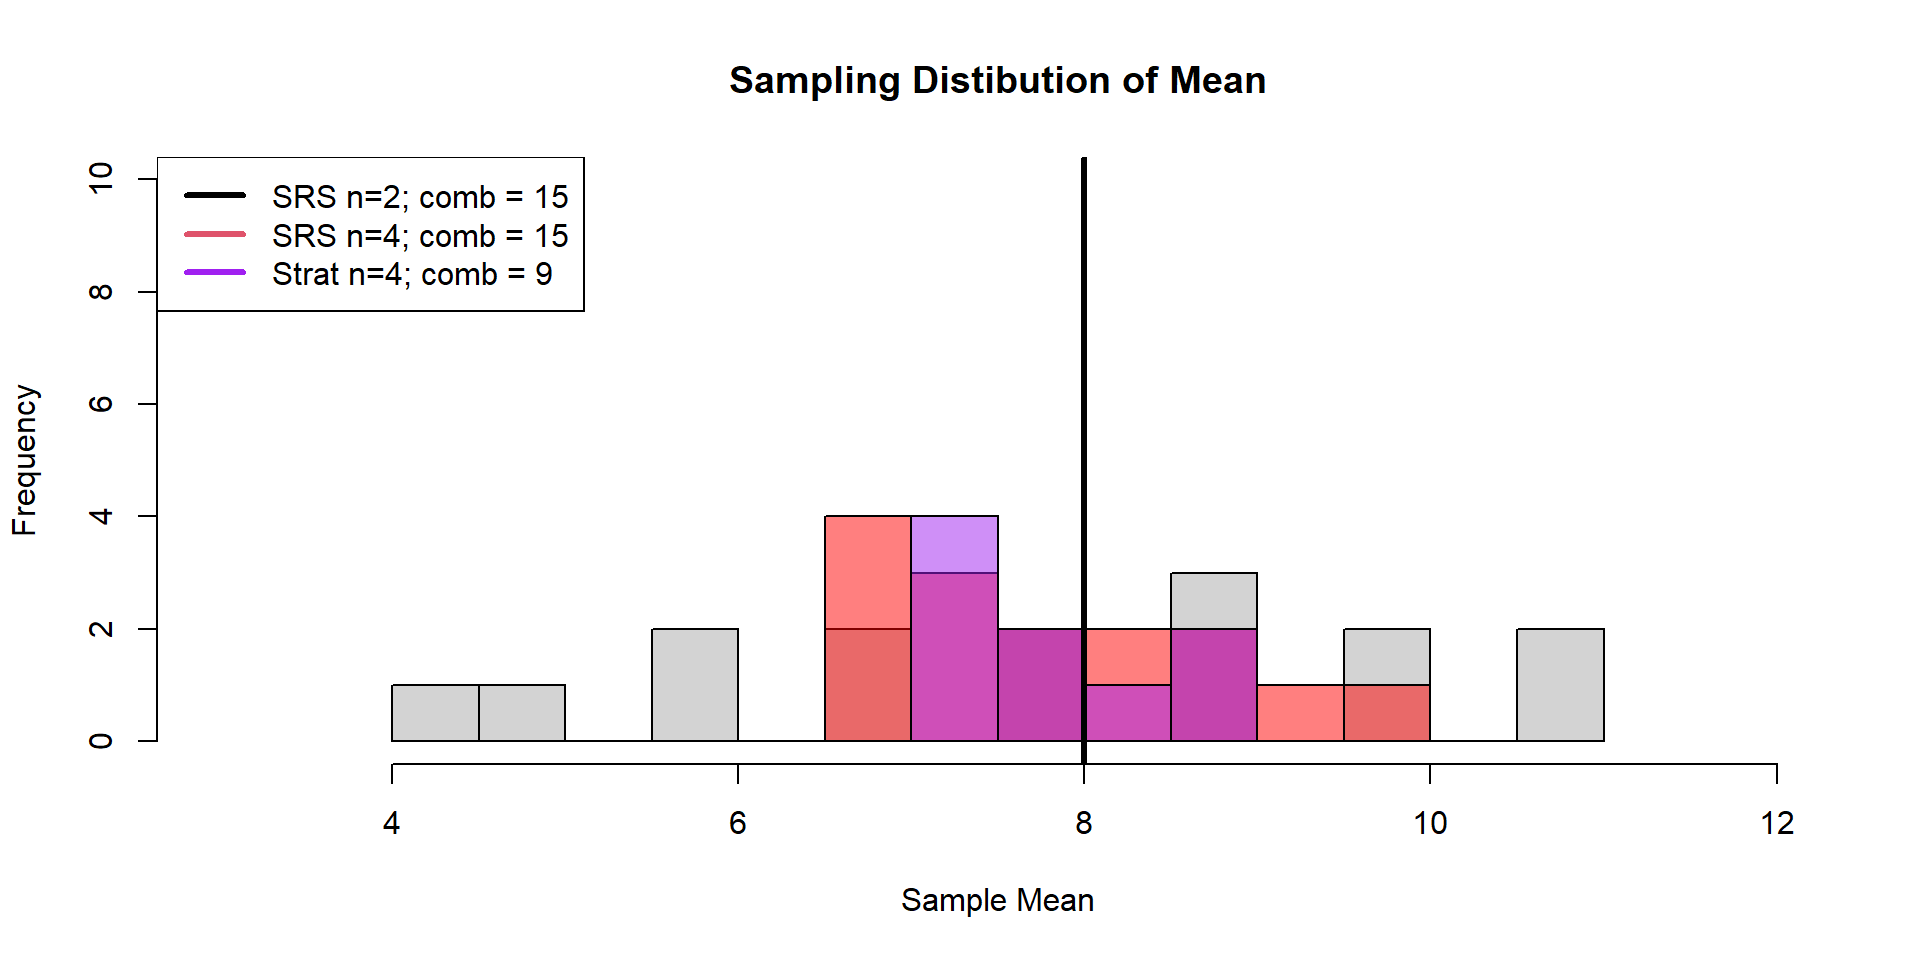
Boreal Toad (Case Study)
How may unique combinations?
First strata
Second strata
All Combinations
| Sample | S1.1 | S1.2 | S2.1 | S2.2 | Mean.S1 | Mean.S2 | Var.S1 | Var.S2 |
|---|---|---|---|---|---|---|---|---|
| 1 | A | B | D | E | 4 | 10 | 8 | 0 |
| 2 | A | B | D | F | 4 | 11 | 8 | 2 |
| 3 | A | B | E | F | 4 | 11 | 8 | 2 |
| 4 | A | C | D | E | 5 | 10 | 18 | 0 |
| 5 | A | C | D | F | 5 | 11 | 18 | 2 |
| 6 | A | C | E | F | 5 | 11 | 18 | 2 |
| 7 | B | C | D | E | 7 | 10 | 2 | 0 |
| 8 | B | C | D | F | 7 | 11 | 2 | 2 |
| 9 | B | C | E | F | 7 | 11 | 2 | 2 |
\[ \hat{\sigma}^2_{\hat{\mu},st} = \sum_{h=1}^{L} \left(\frac{N_h}{N}\right)^2 \frac{N_h-n_h}{N_h}\frac{\hat{\sigma}^2_{h}}{n_h} \]
| S1.1 | S1.2 | S2.1 | S2.2 | Mean.S1 | Mean.S2 | Var.S1 | Var.S2 | Var.mean |
|---|---|---|---|---|---|---|---|---|
| A | B | D | E | 4 | 10 | 8 | 0 | 0.33 |
| A | B | D | F | 4 | 11 | 8 | 2 | 0.42 |
| A | B | E | F | 4 | 11 | 8 | 2 | 0.42 |
| A | C | D | E | 5 | 10 | 18 | 0 | 0.75 |
| A | C | D | F | 5 | 11 | 18 | 2 | 0.83 |
| A | C | E | F | 5 | 11 | 18 | 2 | 0.83 |
| B | C | D | E | 7 | 10 | 2 | 0 | 0.08 |
| B | C | D | F | 7 | 11 | 2 | 2 | 0.17 |
| B | C | E | F | 7 | 11 | 2 | 2 | 0.17 |
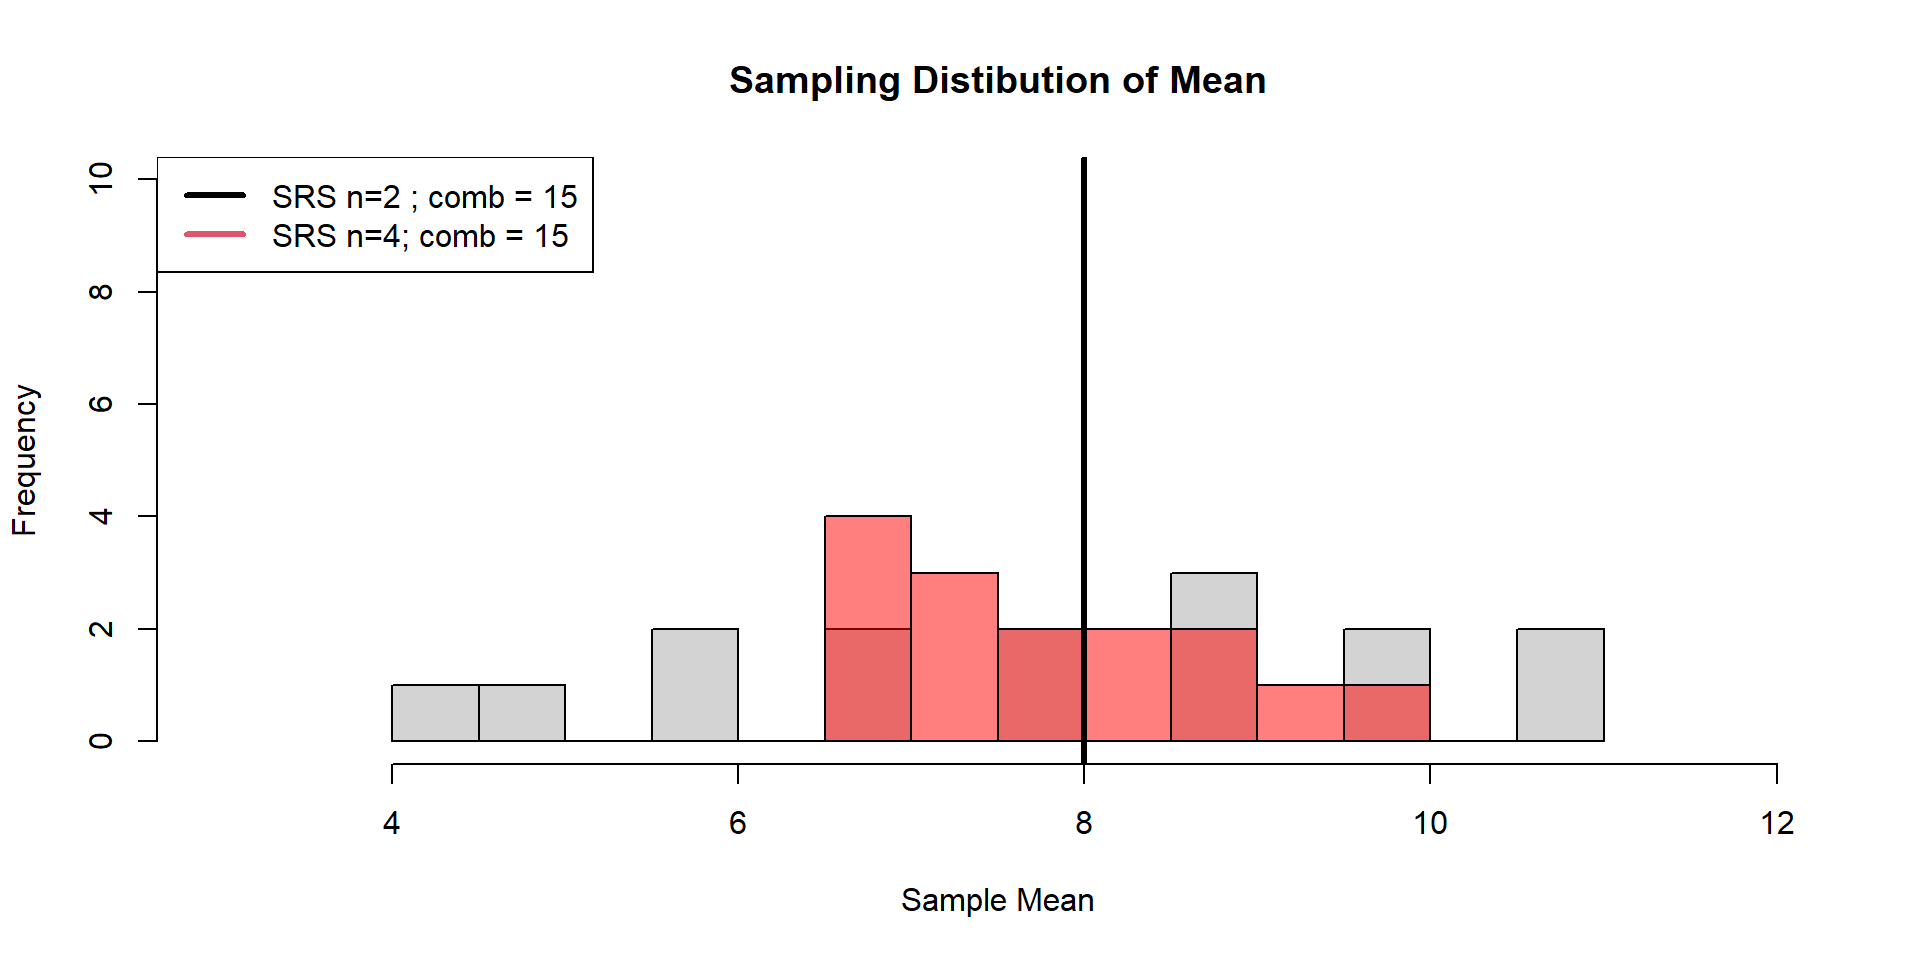
Stratifed
E[Sampling Distribution Variance] = 0.44
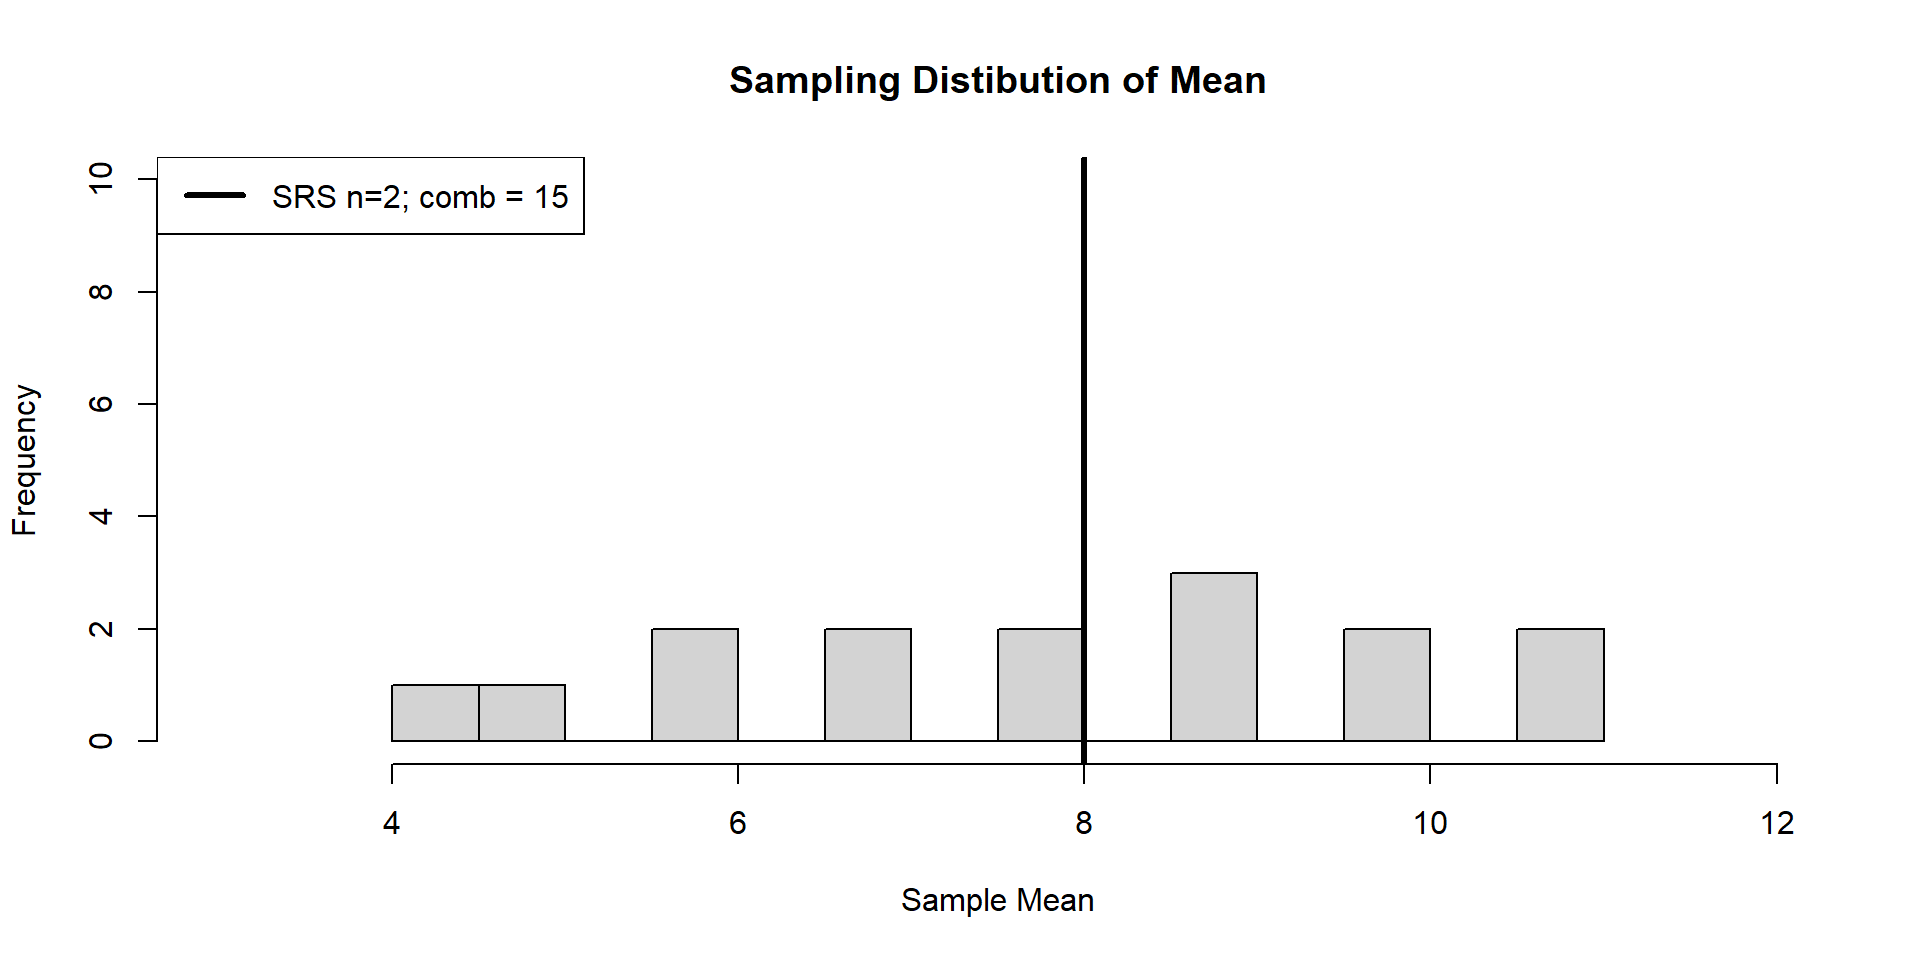
SRS
E[Sampling Distribution Variance] = 4.26
Boreal Toad (Case Study)
Boreal Toad (Case Study)
Boreal Toad (Case Study)
Boreal Toad (Case Study)
Stratification Allocation
Sample Size per Strata
- uniform distribution; \(n_1 = 2 ; n_2 = 2\)
- variable distribution; e.g., \(n_1 = 3 ; n_2 = 1\)
- allocation proportional to size (e.g. area): \(n_h = \frac{nN_h}{N}\)
- optimal allocation for fixed \(n\): \(n_h = \frac{nN_h\sigma_h}{\sum_{k=1}^L N_k\sigma_k}\)
Stratification Allocation
Allocate most of our samples to the strata with the highest variance
| Pond | egg.mass | strata |
|---|---|---|
| A | 2 | 1 |
| B | 6 | 1 |
| C | 8 | 1 |
| D | 10 | 2 |
| E | 10 | 2 |
| F | 12 | 2 |
How many possible sample combinations are there?
Stratification Allocation
| Sample | S1.1 | S1.2 | S1.3 | S2.1 | Mean.S1 | Mean.S2 | pop.means |
|---|---|---|---|---|---|---|---|
| 1 | A | B | C | D | 5.333333 | 10 | 7.666667 |
| 2 | A | B | C | E | 5.333333 | 10 | 7.666667 |
| 3 | A | B | C | F | 5.333333 | 12 | 8.666667 |
- removed the variance from stratum 1
Stratification Allocation
Reverse the situation- allocate more samples to the least variable stratum
| Pond | egg.mass | strata |
|---|---|---|
| A | 2 | 1 |
| B | 6 | 1 |
| C | 8 | 1 |
| D | 10 | 2 |
| E | 10 | 2 |
| F | 12 | 2 |
| Sample | S1.1 | S2.1 | S2.2 | S2.3 | Mean.S1 | Mean.S2 | pop.means |
|---|---|---|---|---|---|---|---|
| 1 | A | D | E | F | 2 | 10.66667 | 6.333333 |
| 2 | B | D | E | F | 6 | 10.66667 | 8.333333 |
| 3 | C | D | E | F | 8 | 10.66667 | 9.333333 |
- compared to population means of 7.6, 7.6, and 8.6
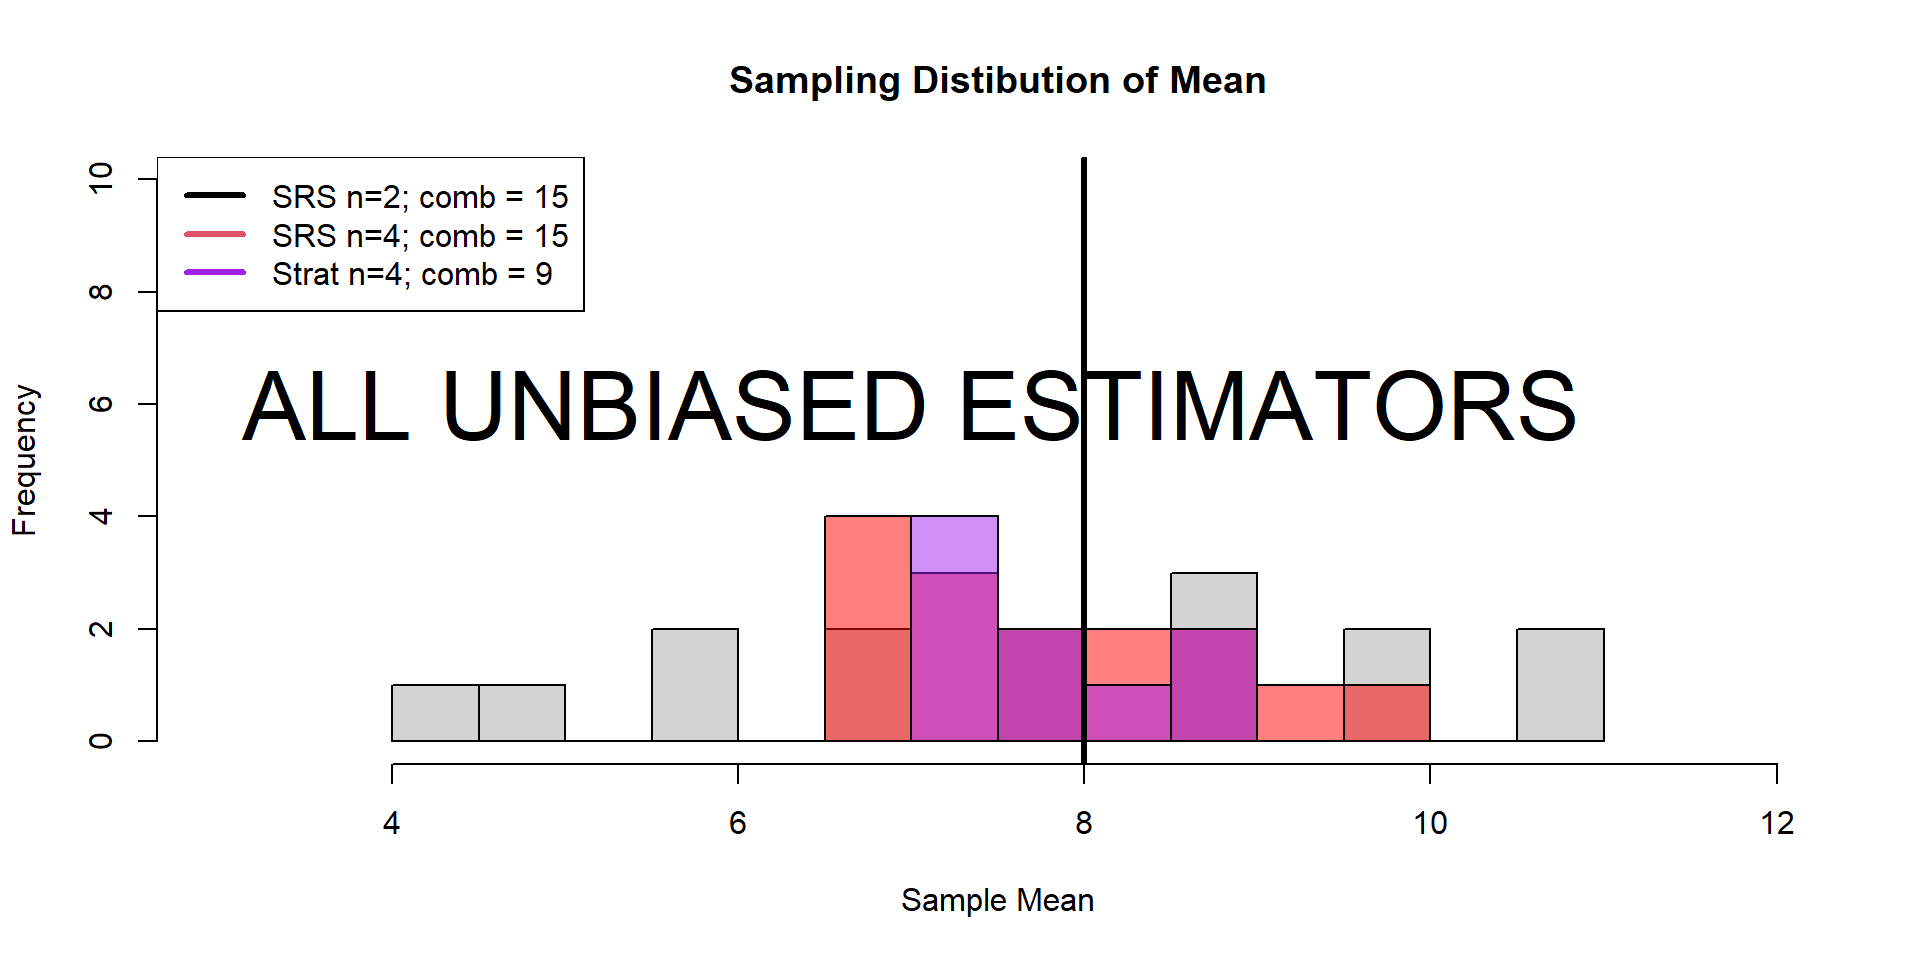
- Estimator population means is still unbisaed
- \(E[\hat{\mu}_{st}] = (6.333 + 8.333 + 9.333) / 3 = 8 = \mu\)
SRS Estimator
What if we ignored the stratification and used the SRS sample mean estimator?
| S1 | S2 | S3 |
|---|---|---|
| 2 | 6 | 8 |
| 10 | 10 | 10 |
| 10 | 10 | 10 |
| 12 | 12 | 12 |
- Sample means are 8.5, 9.5, 10
Population mean is 9.3333333
\(E[\hat{\mu}_{SRS}] \neq \mu\)
Unequal Sampling Fractions
| Pond | egg.mass | strata |
|---|---|---|
| A | 2 | 1 |
| B | 6 | 1 |
| C | 8 | 1 |
| D | 10 | 2 |
| E | 10 | 2 |
| F | 12 | 2 |
- Strata 1, \(\text{weight}_{i}\) = \(1/n_h = 1/1 =1\)
- Strata 2, \(\text{weight}_{i}\) = \(1/n_h = 1/3\)
Unequal Sampling Fractions
\[ \hat{\mu}_{st} = \frac{1}{L}\sum_{h=1}^L \sum_{i=1}^{n_h} y_{hi}\times \text{weight}_h \]
| Strata | S1 | S2 | S3 | Weight |
|---|---|---|---|---|
| 1 | 2 | 6 | 8 | 1.0000000 |
| 2 | 10 | 10 | 10 | 0.3333333 |
| 2 | 10 | 10 | 10 | 0.3333333 |
| 2 | 12 | 12 | 12 | 0.3333333 |
Sample 1
\[ \hat{\mu}_{st} = \frac{\left(2\times1\right) + \left(10\times1/3 + 10\times1/3 + 12\times1/3 \right)}{2} \]
Pseudo Random Sampling
- In practice random sampling can be expensive; can feel wasteful
- Stratification improves the ‘targetedness’ of sampling
- Sometimes the samples per strata are random but then the selection of individuals or specific subplots within sampled strata are left to the observers to choose. (
Quota Sampling)
Quota Sampling
Observer Freedom
- selection bias is present
- selection procedure is ill-defined; Standard Error’s have no valid estimator
- “But quota sampling always achieves the same sample size [within strata] as random sampling”
Quota Sampling
- The increased flexibility comes at a reduction of sample credibility
- Selection bias
- Non-response bias
- No valid measures of uncertainty
Summary
- Units need a probability of being sampled but don’t need to be the same
- Stratification requires accounting for within strata sample size (i.e., the weighting)
- Stratification allocations allow us a means to reduce the population sampling distribution variance
- Sampling an entire strata is perfectly fine
- Construct strata so their averages are different as possible and their variances are as small as possible (i.e., approx. homogenous)
- Need at least \(n_h \geq 2\) to estimate variability in a stratum