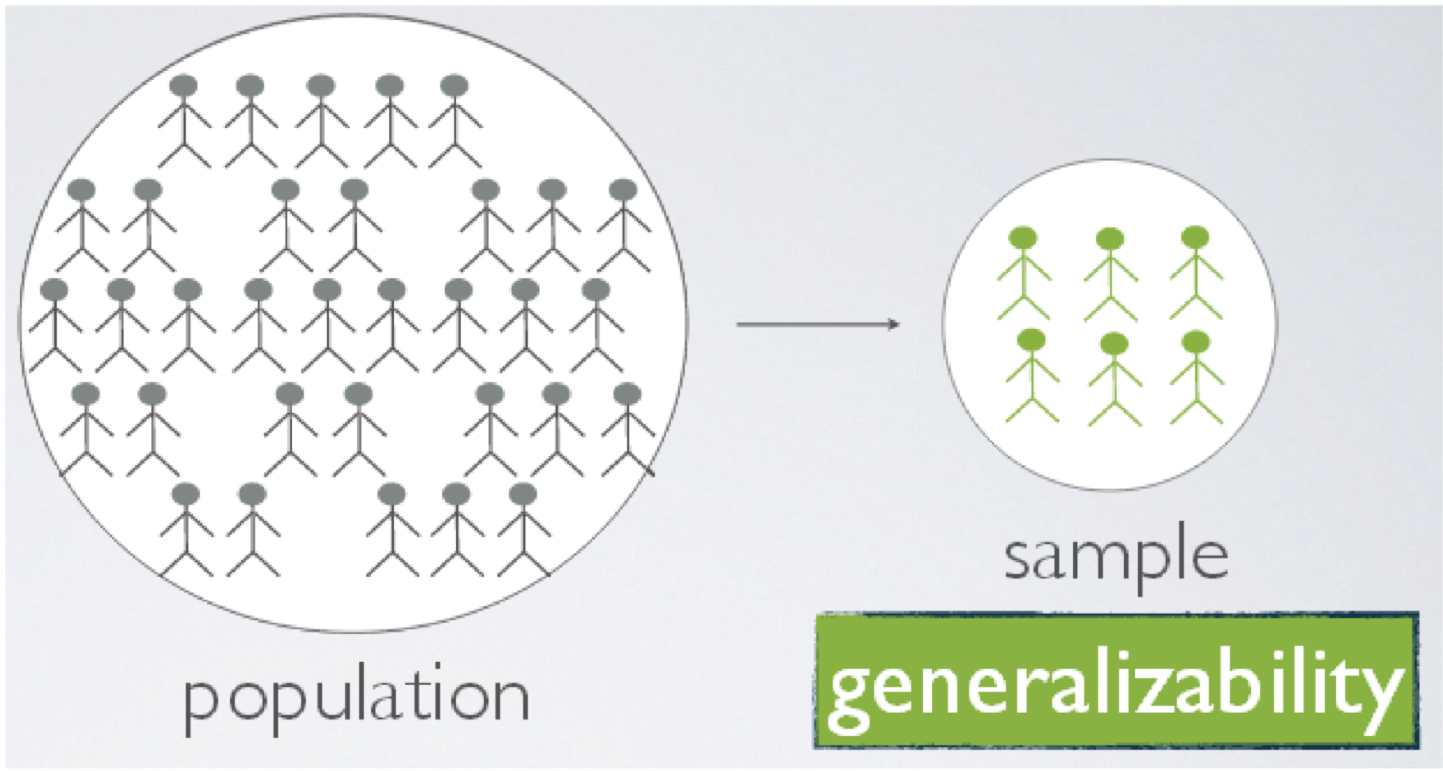
Population and Sample
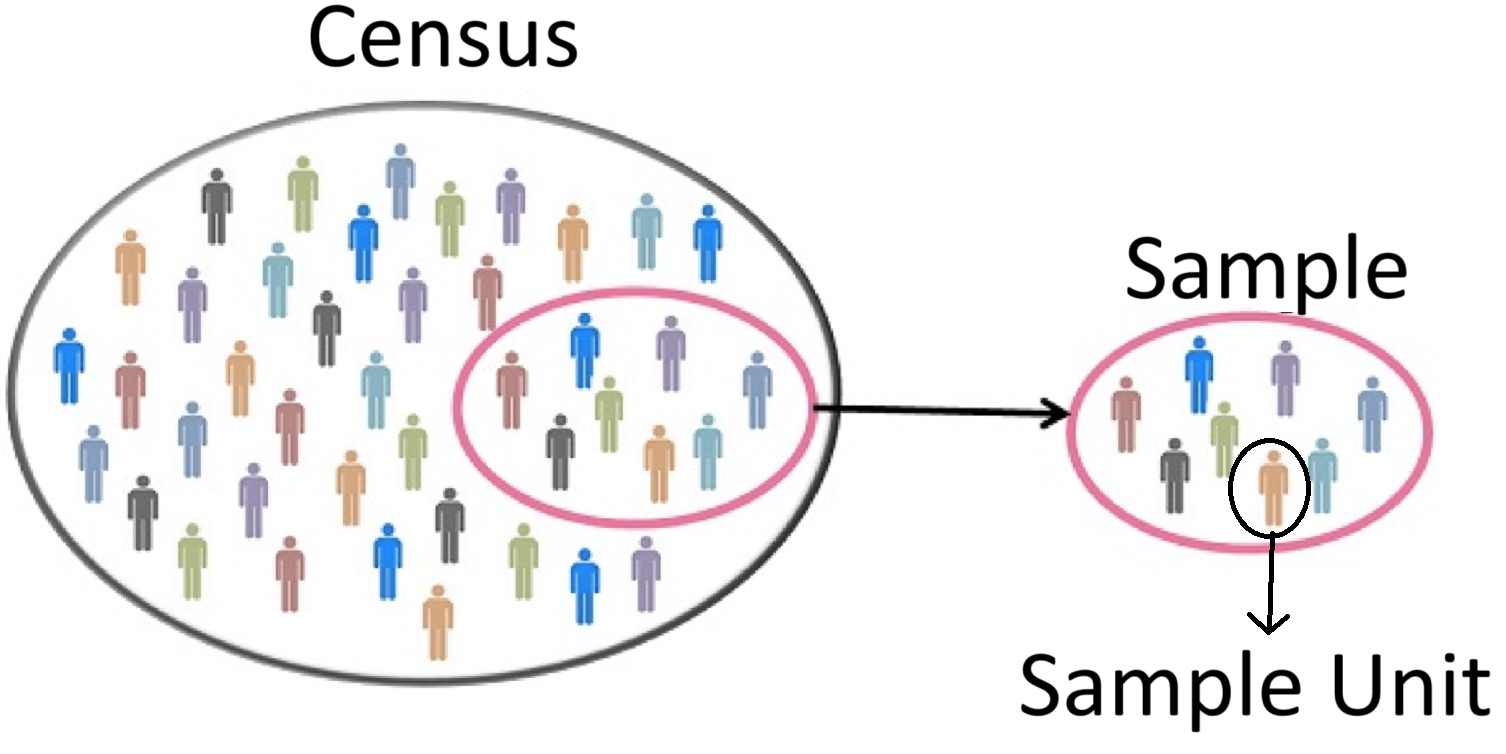
Define 1) census, 2) sample, and 3) sampling?
Population and Sample To use a sample to describe a ‘population’ is called what?
Central paradox of Sampling
Sampling Types
Convenient sampling Judgment sampling Probability sampling
Common Sample Units
plots/quadrats - small area to measure/count plants, seeds, insects, etc.points - measurements are taken from a set of points established throughout a populationtransects - line segments in which observations are taken fromindividual organisms - the organism is the sample unit or the organism defines the location of the sample unit
Population and Sample
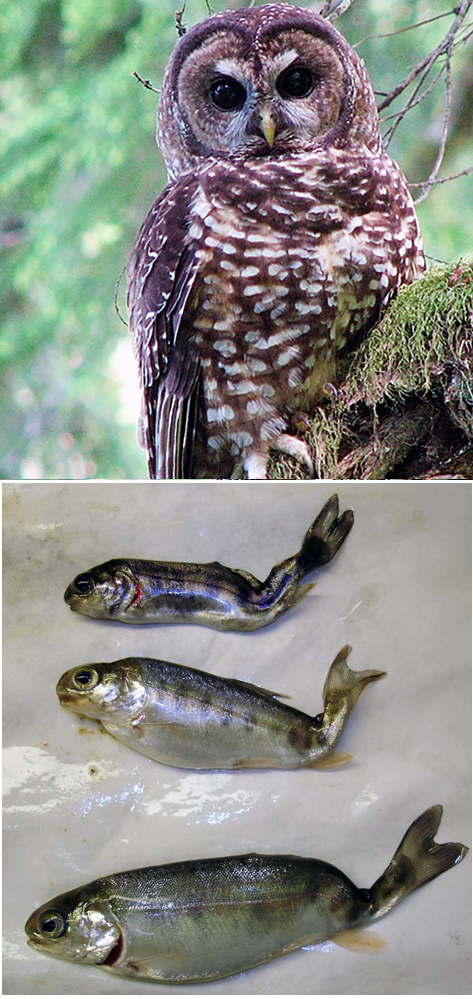
Trees of sufficient size for nesting by spotted owls
House characteristics that northern flickers most often damage
Survival of rainbow trout in the presence of whirling disease
Surveys, e.g., number of people that
bird watch / hunt / fish / think wolves should live in CO
Population and Sample
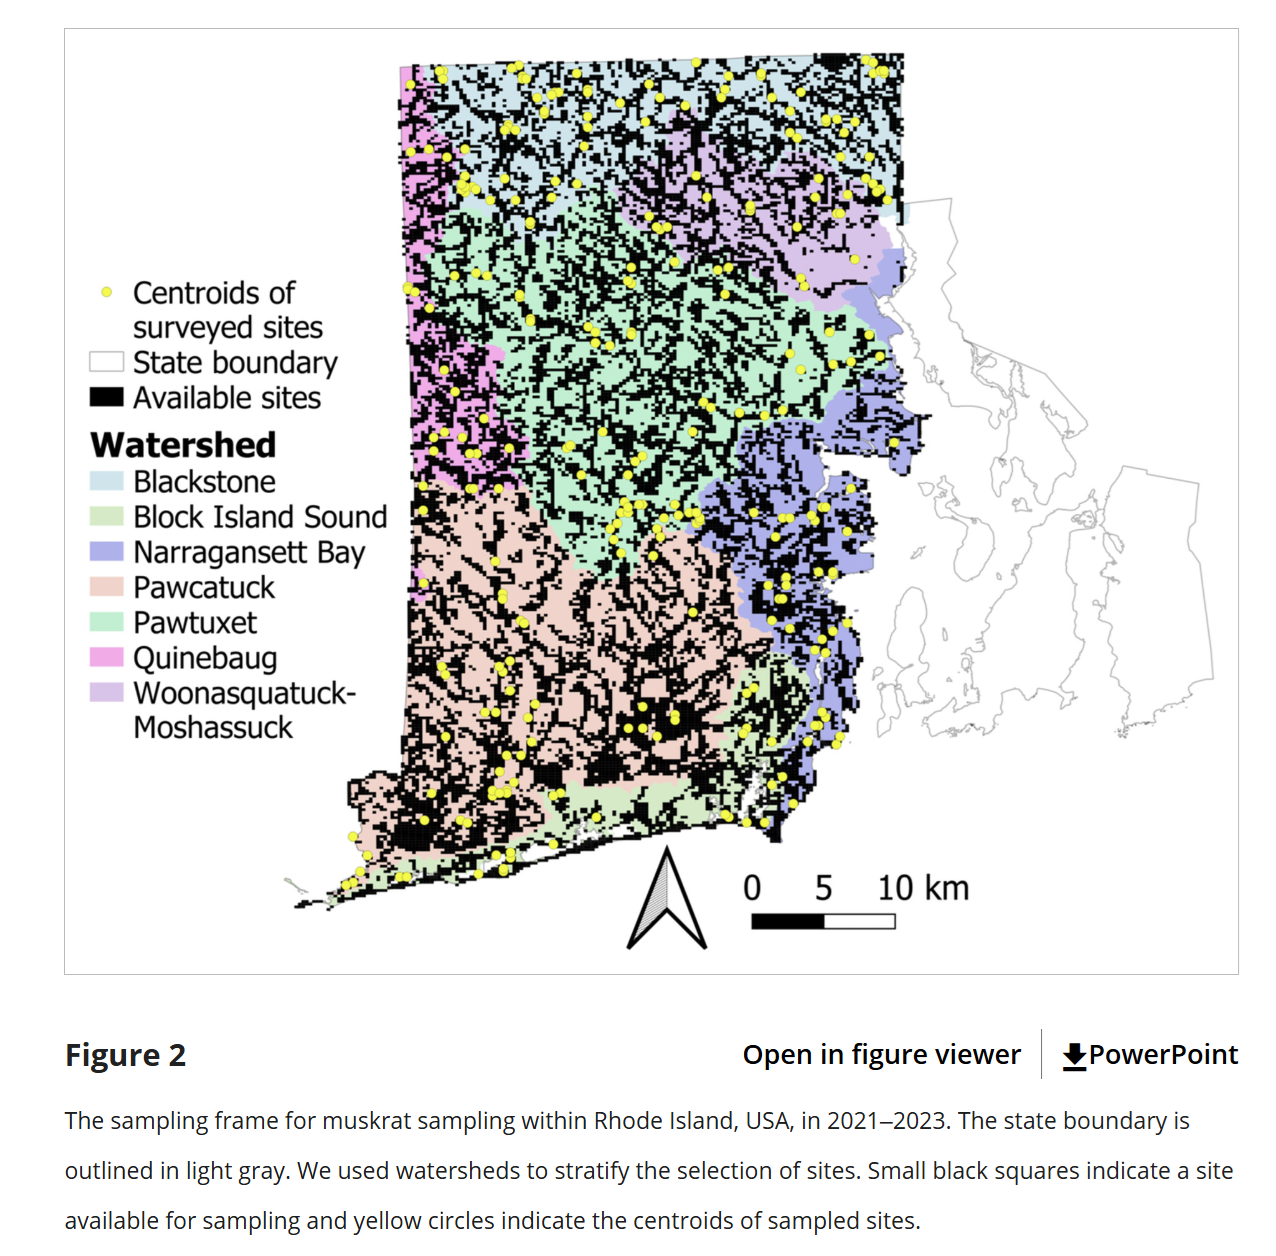
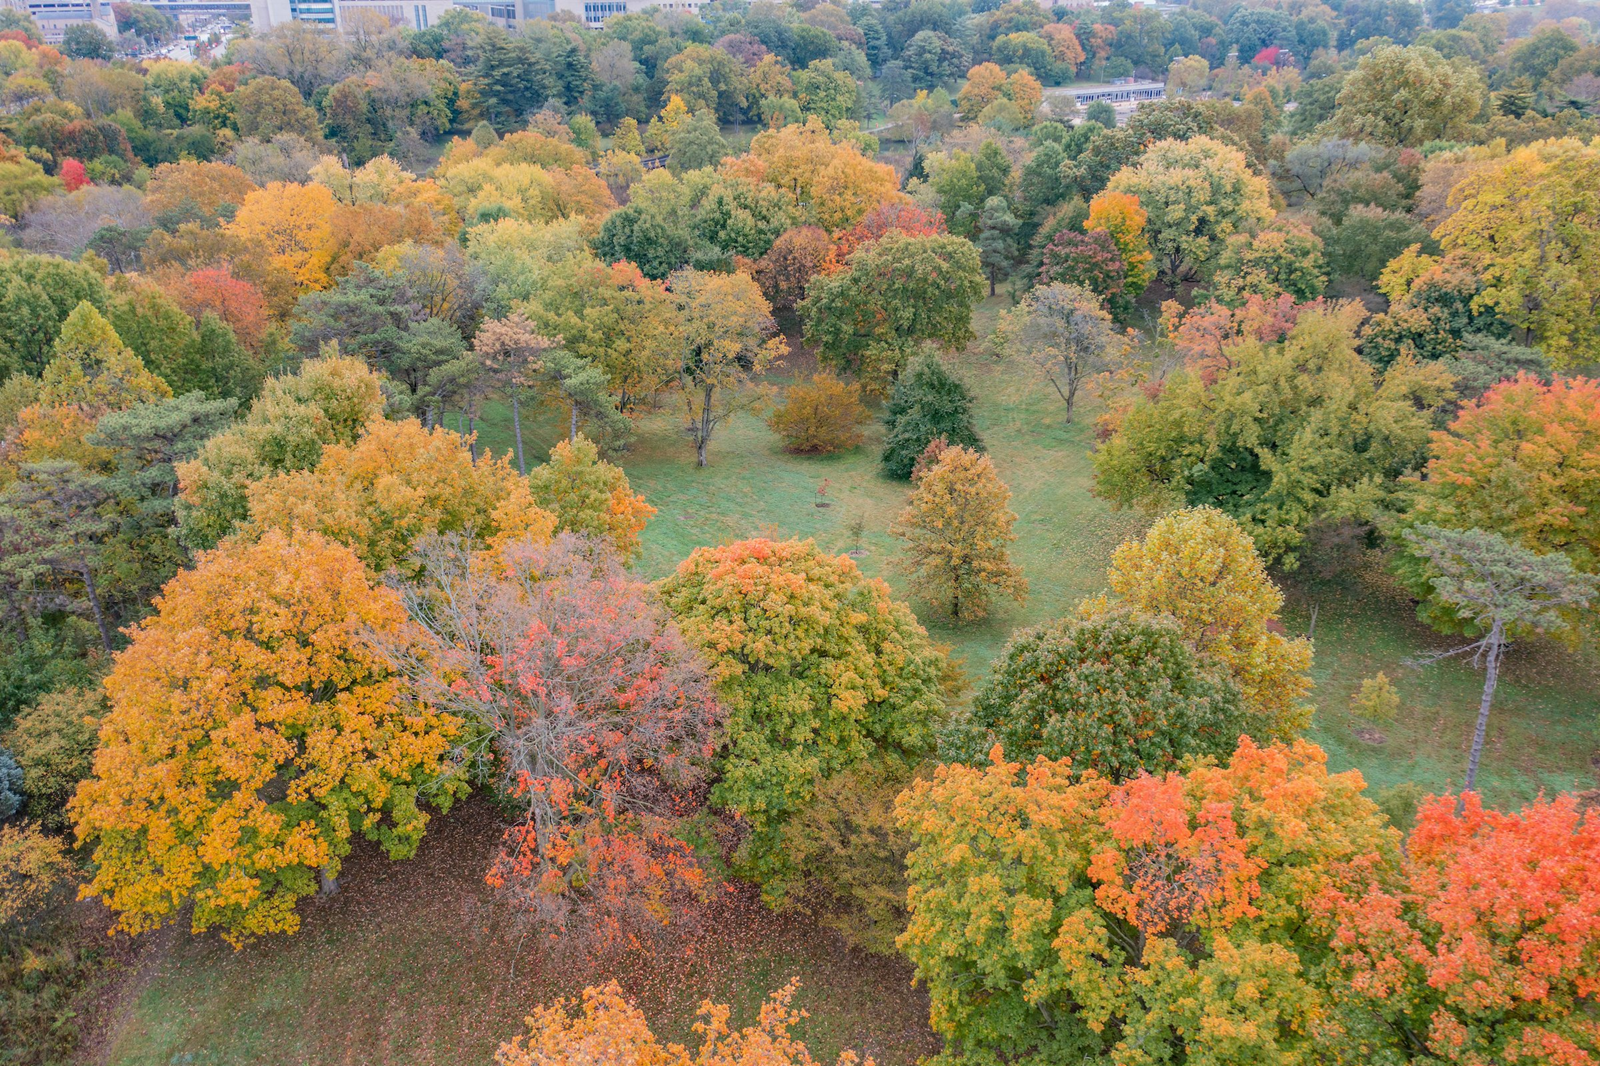
Often a spatial/temporal context to our target population
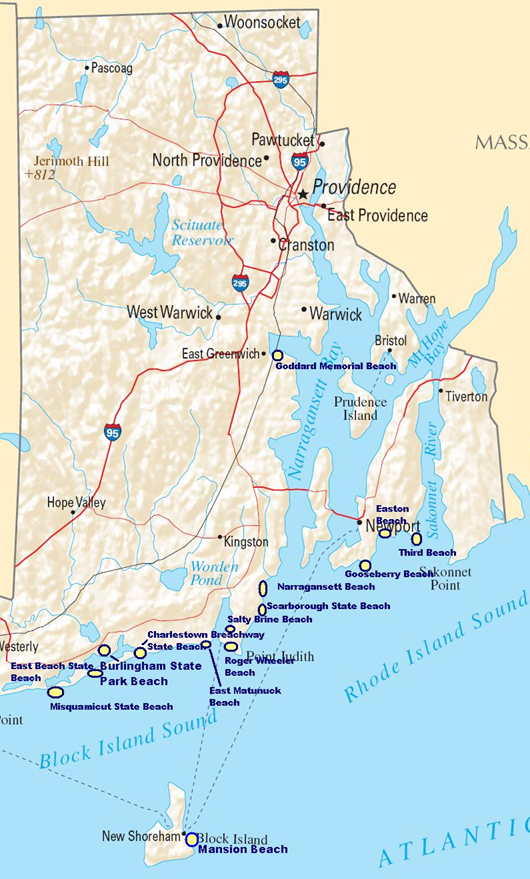
Population and Sample Title: Muskrat occurrence in Rhode Island shows little evidence of land use change driving declines
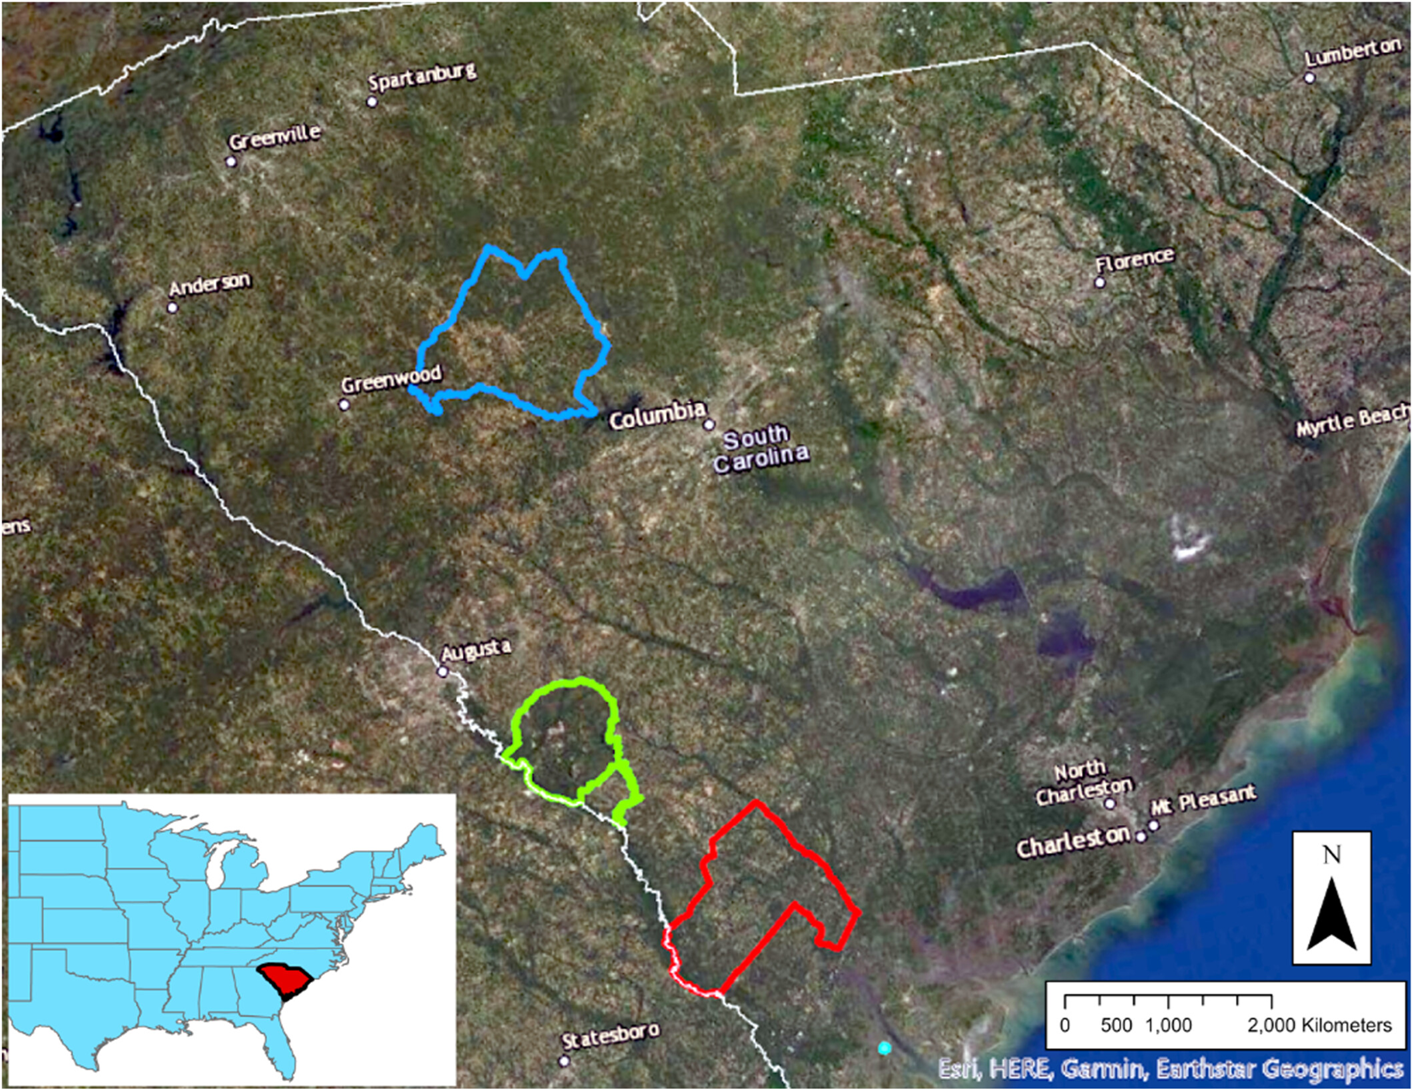
Population and Sample Title: Land cover attributes affect the distribution of rooting damage by wild pigs (Sus scrofa)
Surveys in 1) The Savannah River Site (green) 2) Newberry County (blue), 3) Hampton County (red)
“We generated 9 random points to act as the center of respective 200-ha survey grids”.
“Properties were primarily composed of mixed agricultural-forested cover”.
Generalizability? Compare and contrast
Thinking Backwards Not uncommon!
Thinking Backwards
E.g., Nesting shorebirds are censused each summer at a few beaches.
Can we use these sites as samples to apply to all beaches in the area?
Design vs. Sampling
Experimental Design:
Deliberately perturbing a part of a population to compare it’s effect to a part that was not perturbed
Sampling Design :
The process of obtaining a representative sample to characterize a ‘population’ w/o necessarily perturbing it.
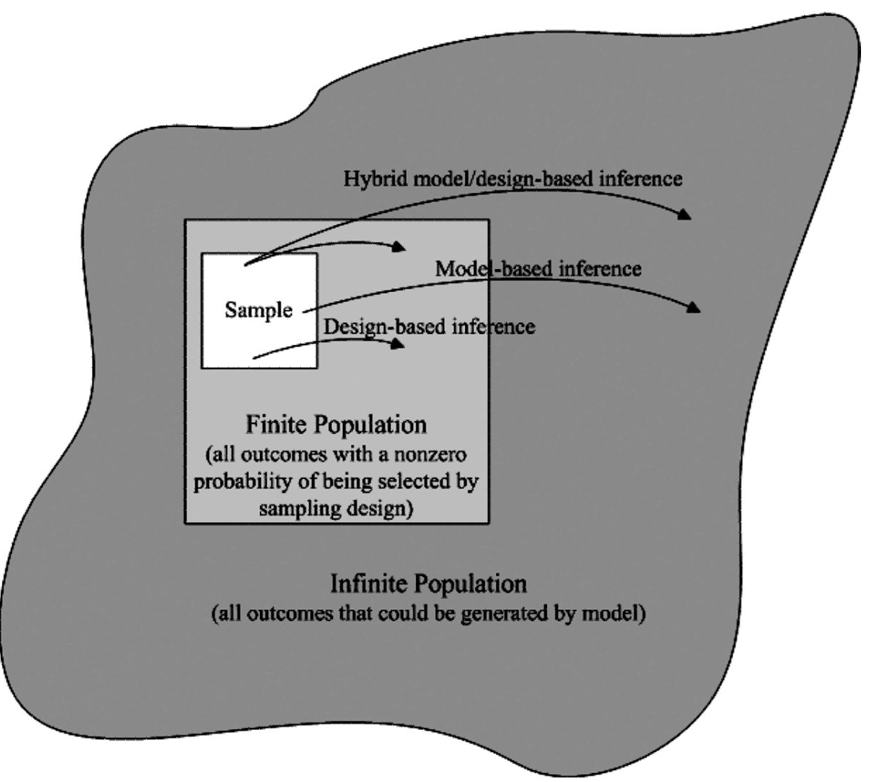
Design- vs Model-based Infernce What are important differences according to Thompson and Hankin et al.?
Benefits or costs of either?
Design- vs Model-based Infernce
Design- vs Model-based Infernce
Sample Language
A sample (height in inches):
\(\textbf{y} = \begin{bmatrix} 69 & 54 & 72 & 61 & 58 & 71 \end{bmatrix}\)
A sample unit:
\(y_{2} =54\)
Sample size:
\(n = 8\)
More Language What is a statistic?
An estimate of a population parameter from a sample
\[\hat{\mu} = \left(\sum_{i=1}^{n}y_{i}\right)\times \frac{1}{n} = 57.7\]
\(n\) is a sample parameter (size of sample)\(\hat{\mu}\) is an estimate of a population parameter (\(\mu\) ) from the estimator (mathematical rule for calculation)57.7 is a statistic (specific value)
More Language \[\mu =\left(\sum_{i=1}^{N}y_{i}\right)\times \frac{1}{N} = 54\]
\(\mu\) is a population parameter (measure of central tendency)\(N\) is a population parameter (size of all possible sample units)\(54\) is the value of the population parameter
Sampling Error
Sampling Error
The difference b/w a sample statistic (specific value) and the true value of a population paramter
57.7 - 54 = 3.3 (inches) sampling error
Due solely to incomplete enumeration of the population (chance)
Protection against this is large sample size
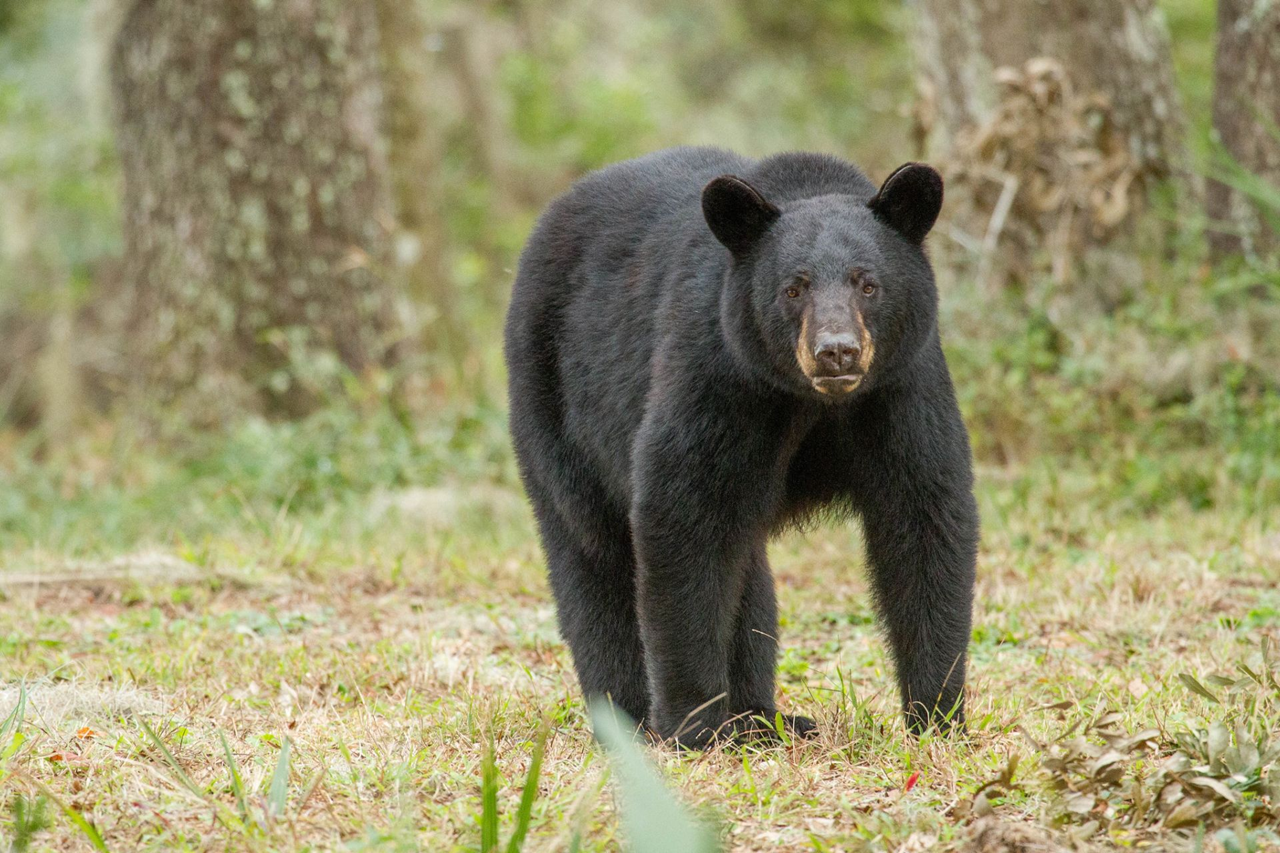
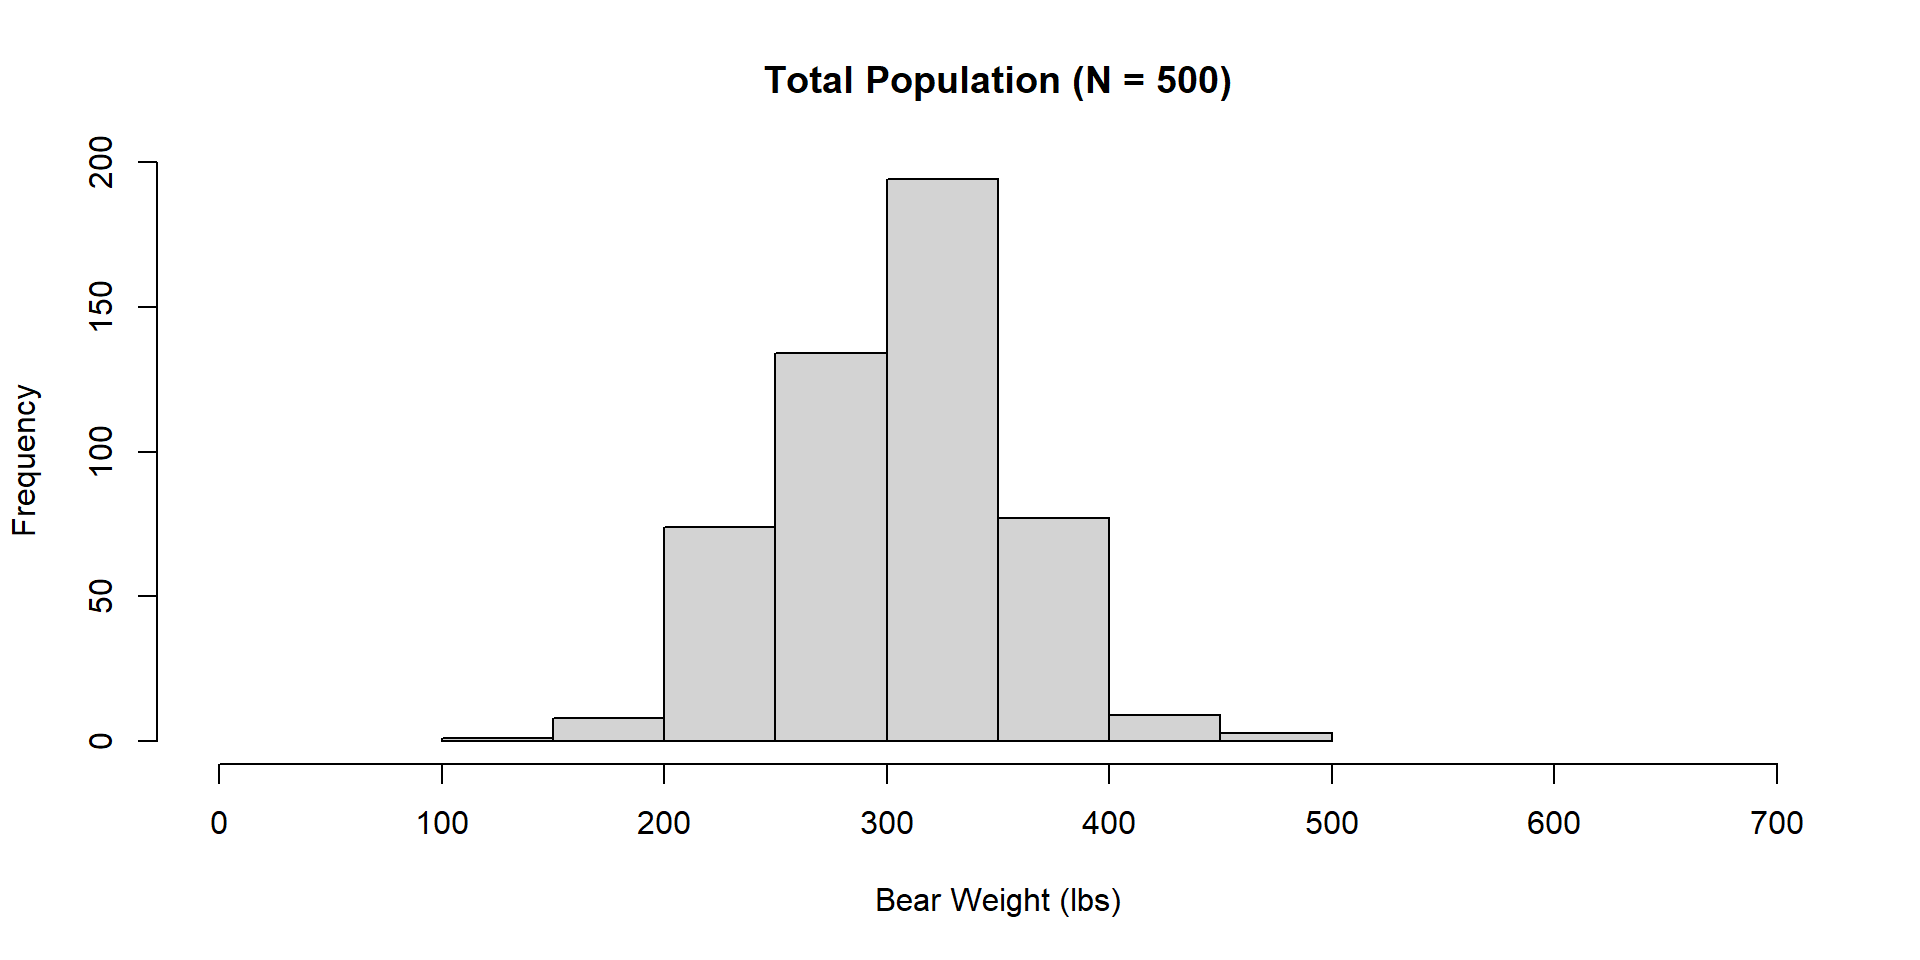
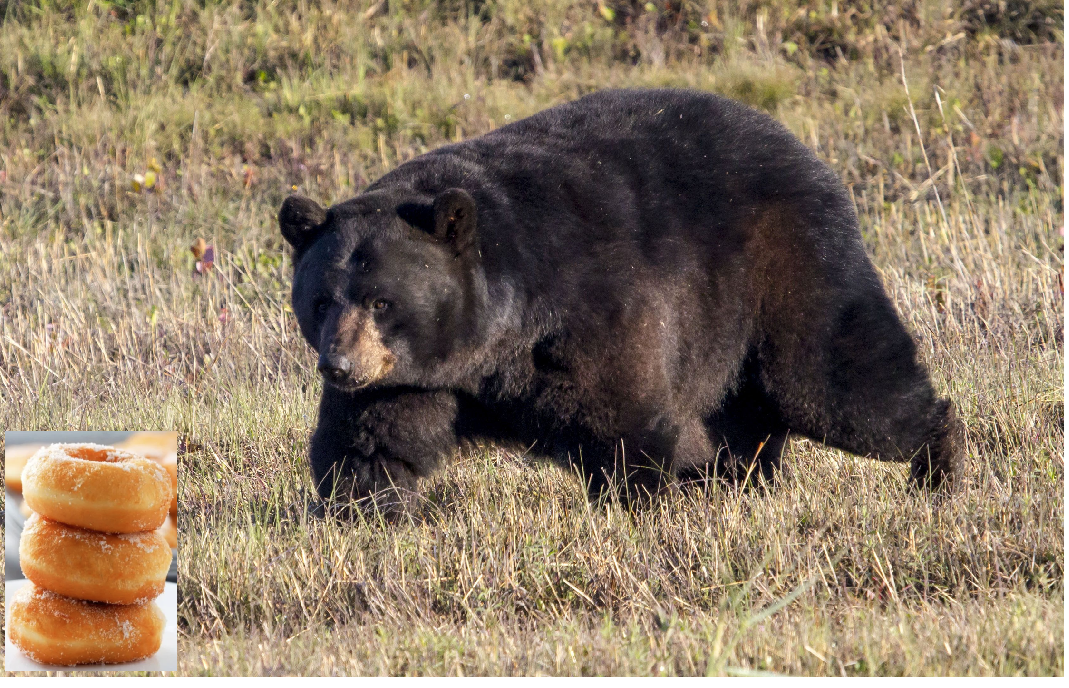
Sampling Variation and Error Target Population: Weight of all black bears in a region
How would you describe a sampling frame relevant to this target population?
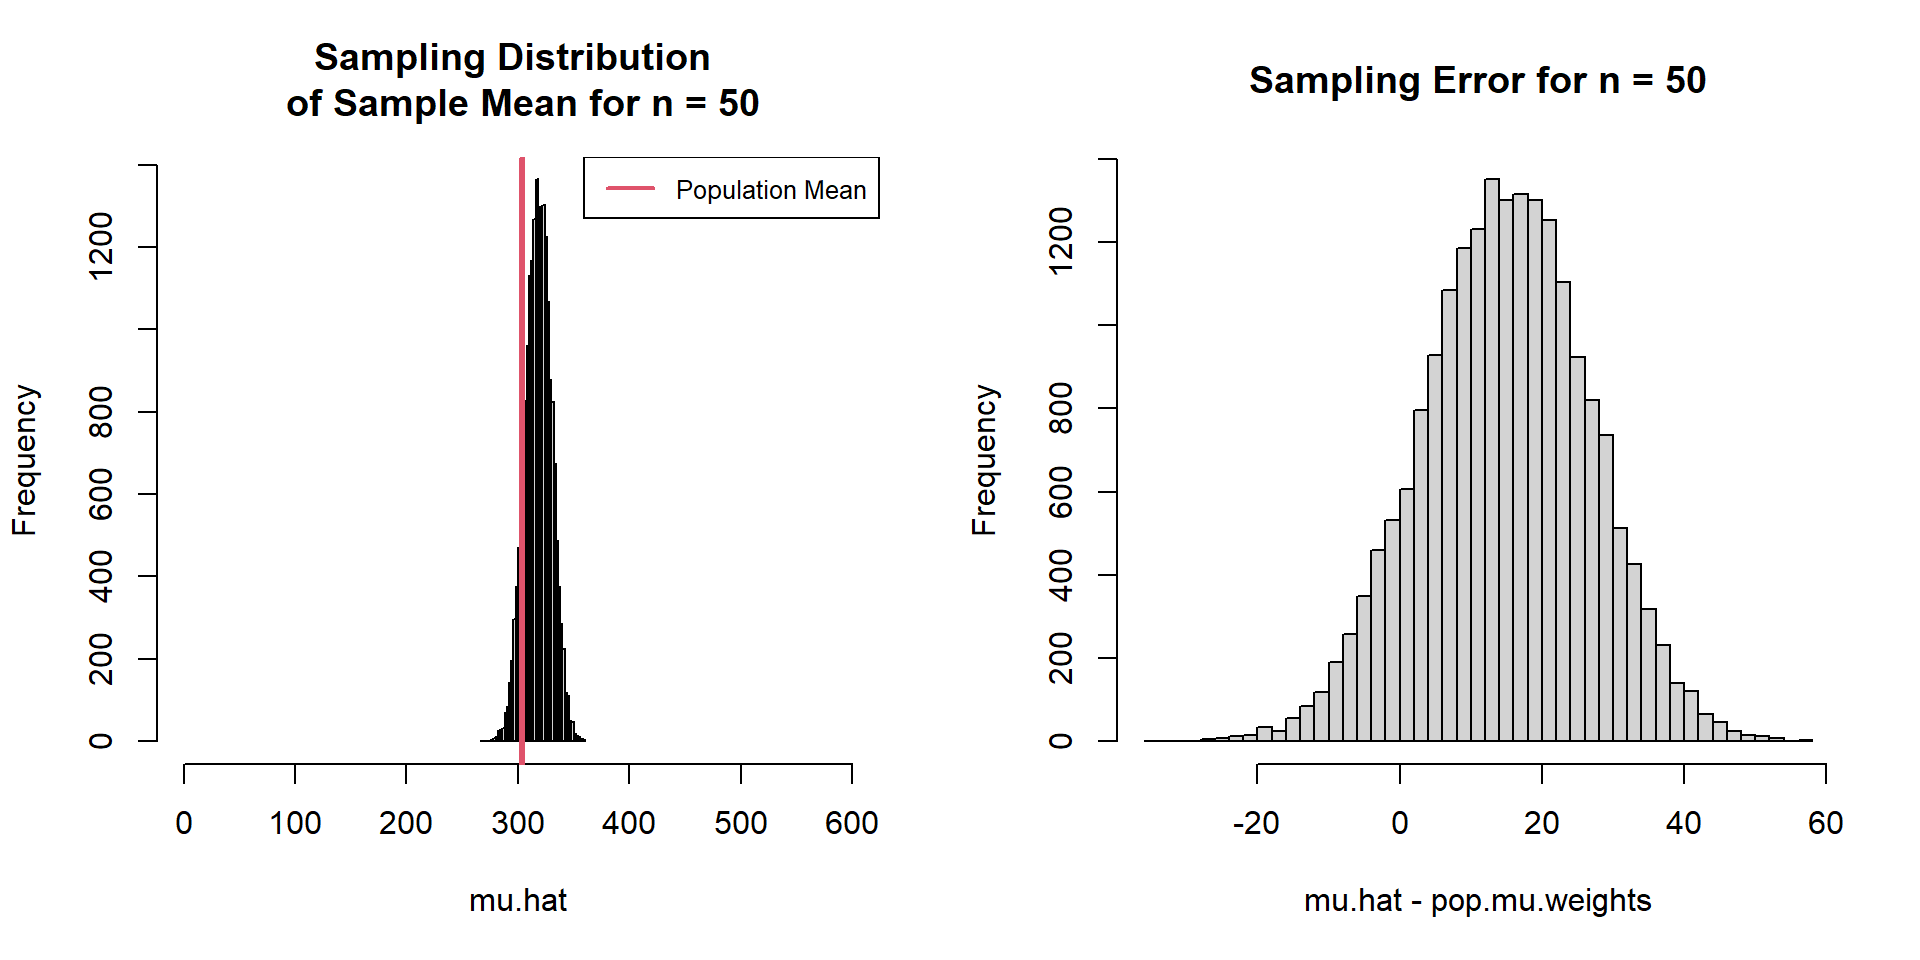
Sampling Variation and Error
Sampling Error Vector of bear weights
[1] 421.7759 185.2152 321.6069 221.8225 284.4739
# Sample Size = 50 # Sample and estimate mean one time .1 = mean (sample (pop.weights,replace = FALSE # Calculate Sampling Error .1 - pop.mu.weights
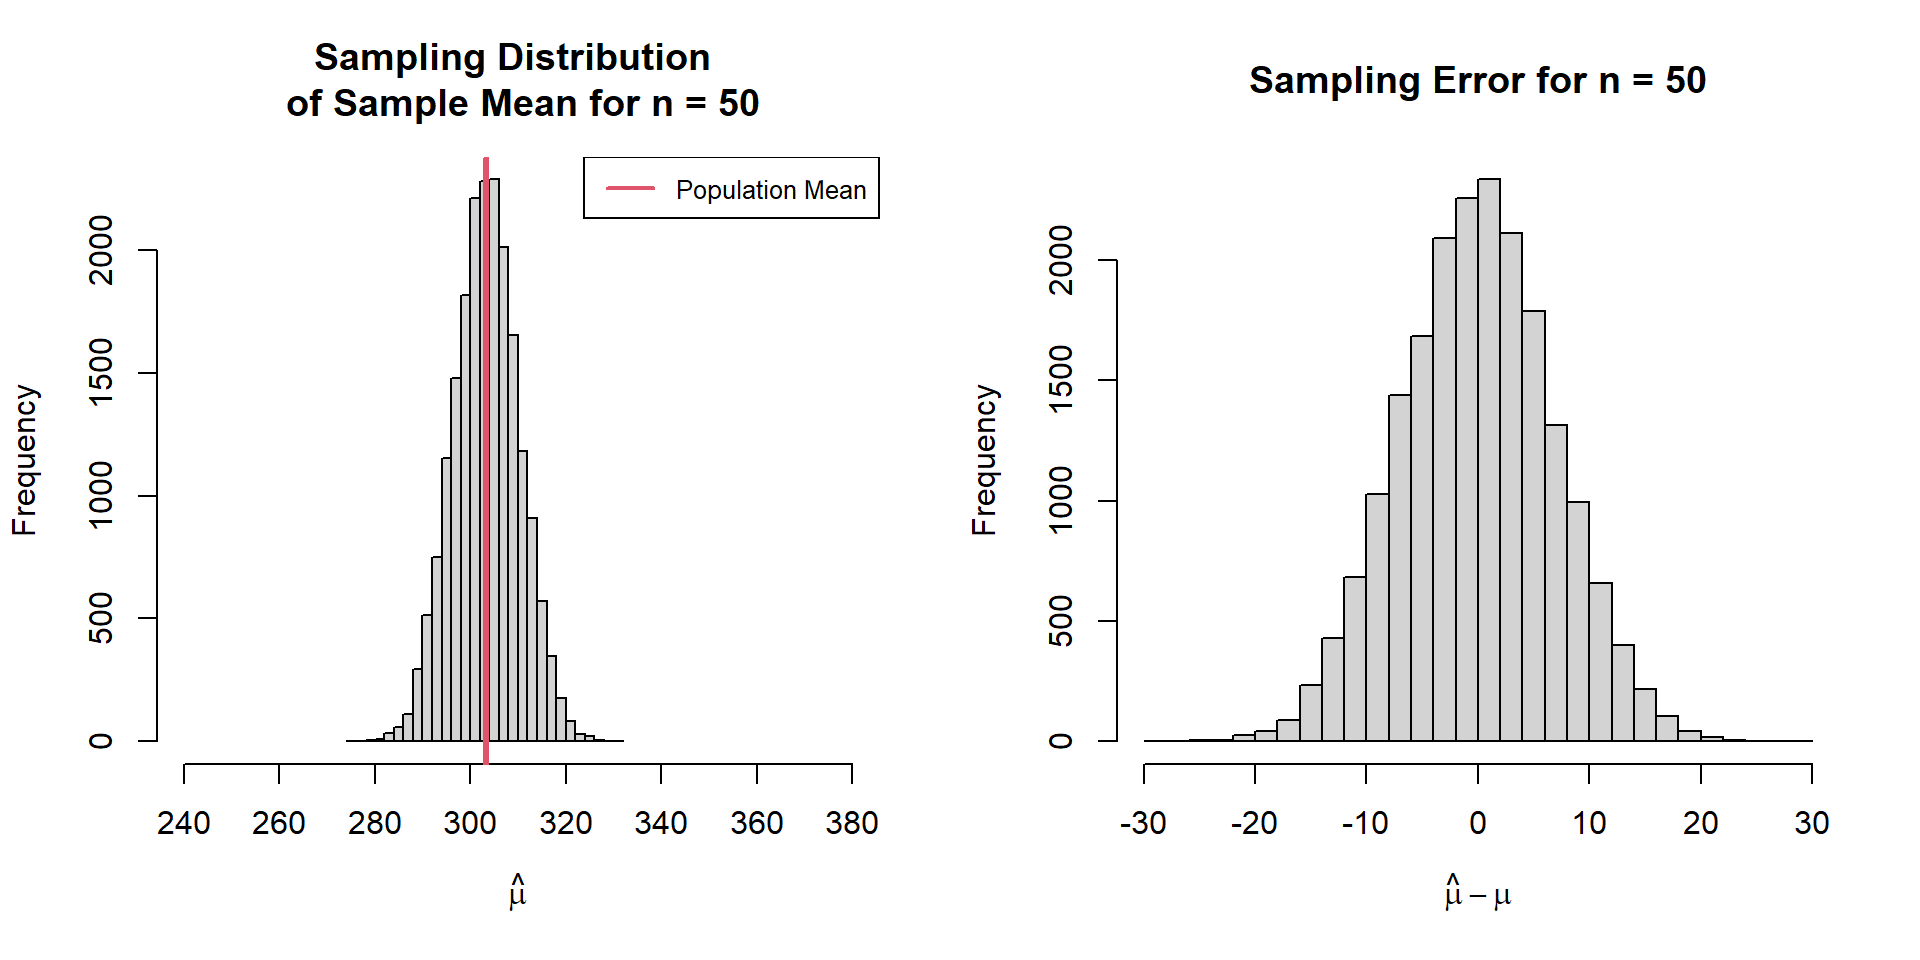
Sampling Variation vs Error Sampling variation is the process and sampling error is an outcome.
The differences between samples (sampling variation) lead to differences between sample statistics and population parameters (sampling error).
Sampling Variation Calculate many many sample means
# Create function to sample 50 units and take the mean = function (target,n){mean (sample (target,n)# Repeat the above function 20000 times = replicate (20000 ,sample.mean.fn (pop.weights,n)
Sampling Variation
Estimator Bias Expected Bias (of the estimator) = average sample mean - population mean
\[
\text{Bias}(\hat{\mu},\mu) = \bar{\hat{\mu}} - \mu \\
\]
\[
\text{Bias}(\hat{\mu},\mu) = E[\hat\mu] - \mu \\
\]
\[
\text{Bias}(\hat{\mu},\mu) = \left(\int_{\hat{\mu}} \hat{\mu} p(\hat{\mu})dx\right) - \mu
\]
This expectation is an average over all samples of size \(n\) .
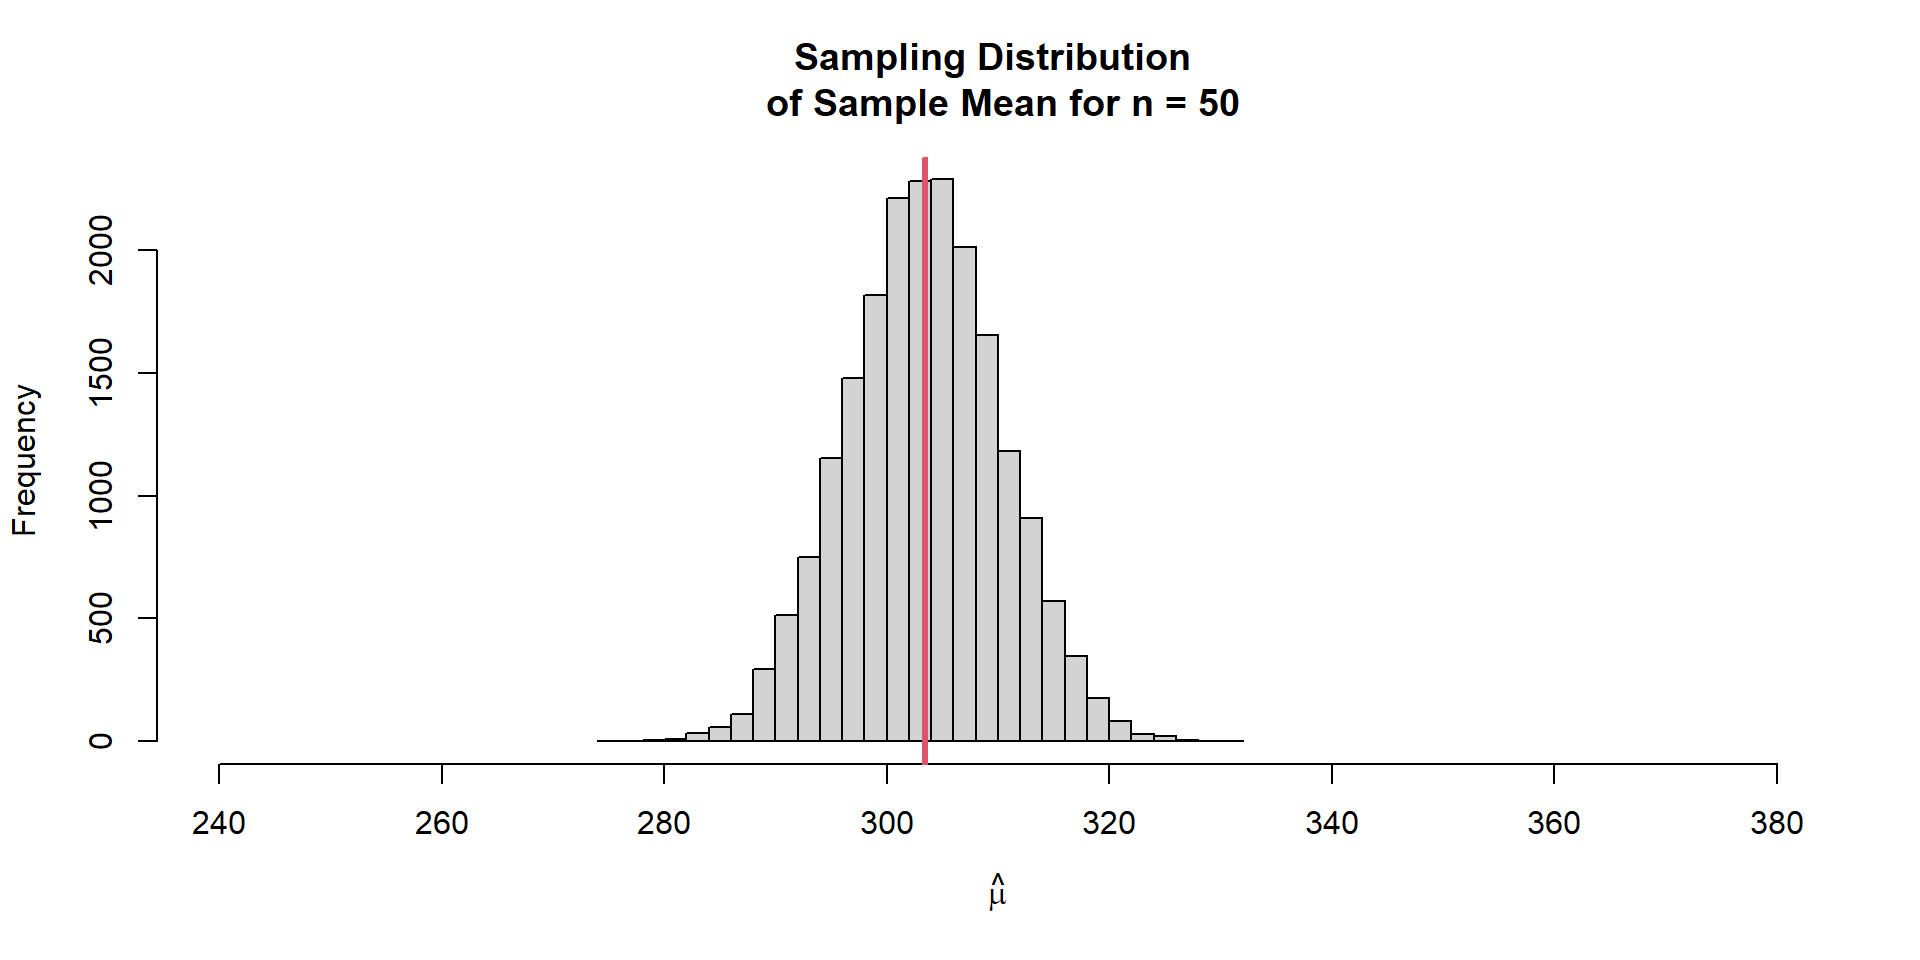
Is our estimator biased?
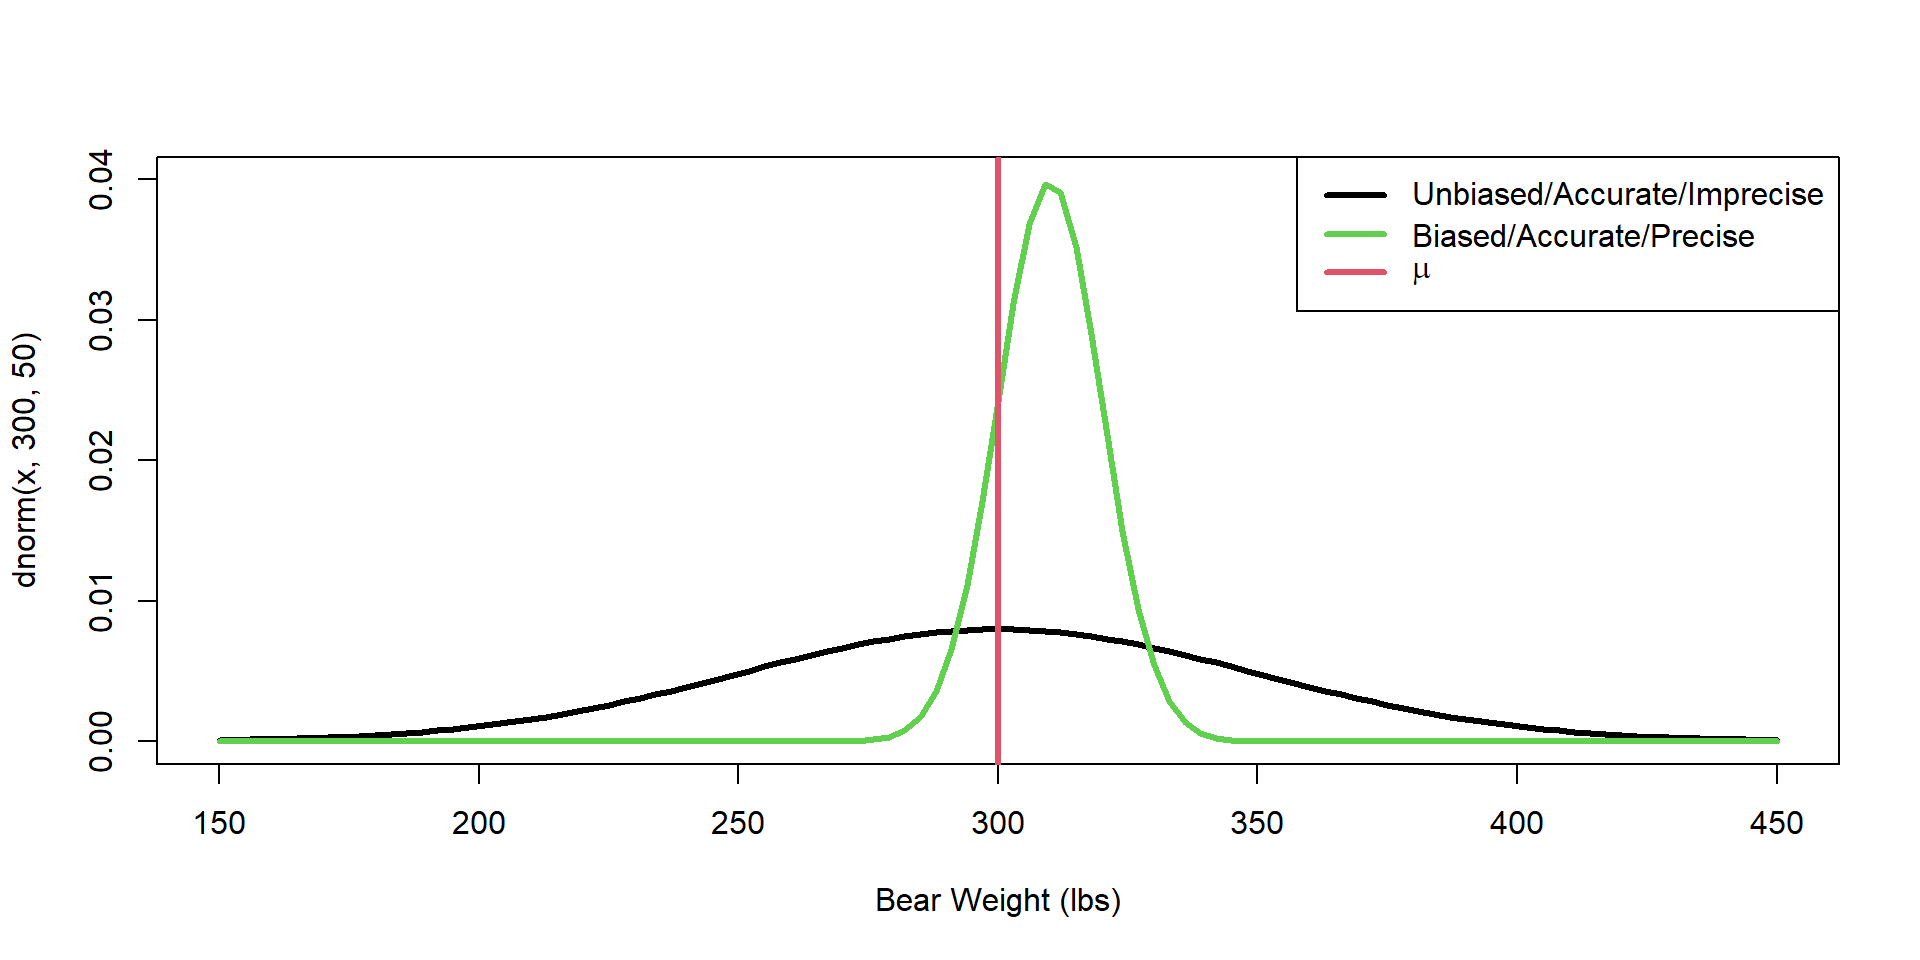
Precision How close are repeated measures to each other?
Probability We can also summarize the sampling variation into a probability
For n = 50, how likely is it that one sample will be within 10% of the true population parameter?
= pop.mu.weights - pop.mu.weights* 0.05 = pop.mu.weights + pop.mu.weights* 0.05 length (which (mu.hat > lower & mu.hat < upper)) / length (mu.hat)
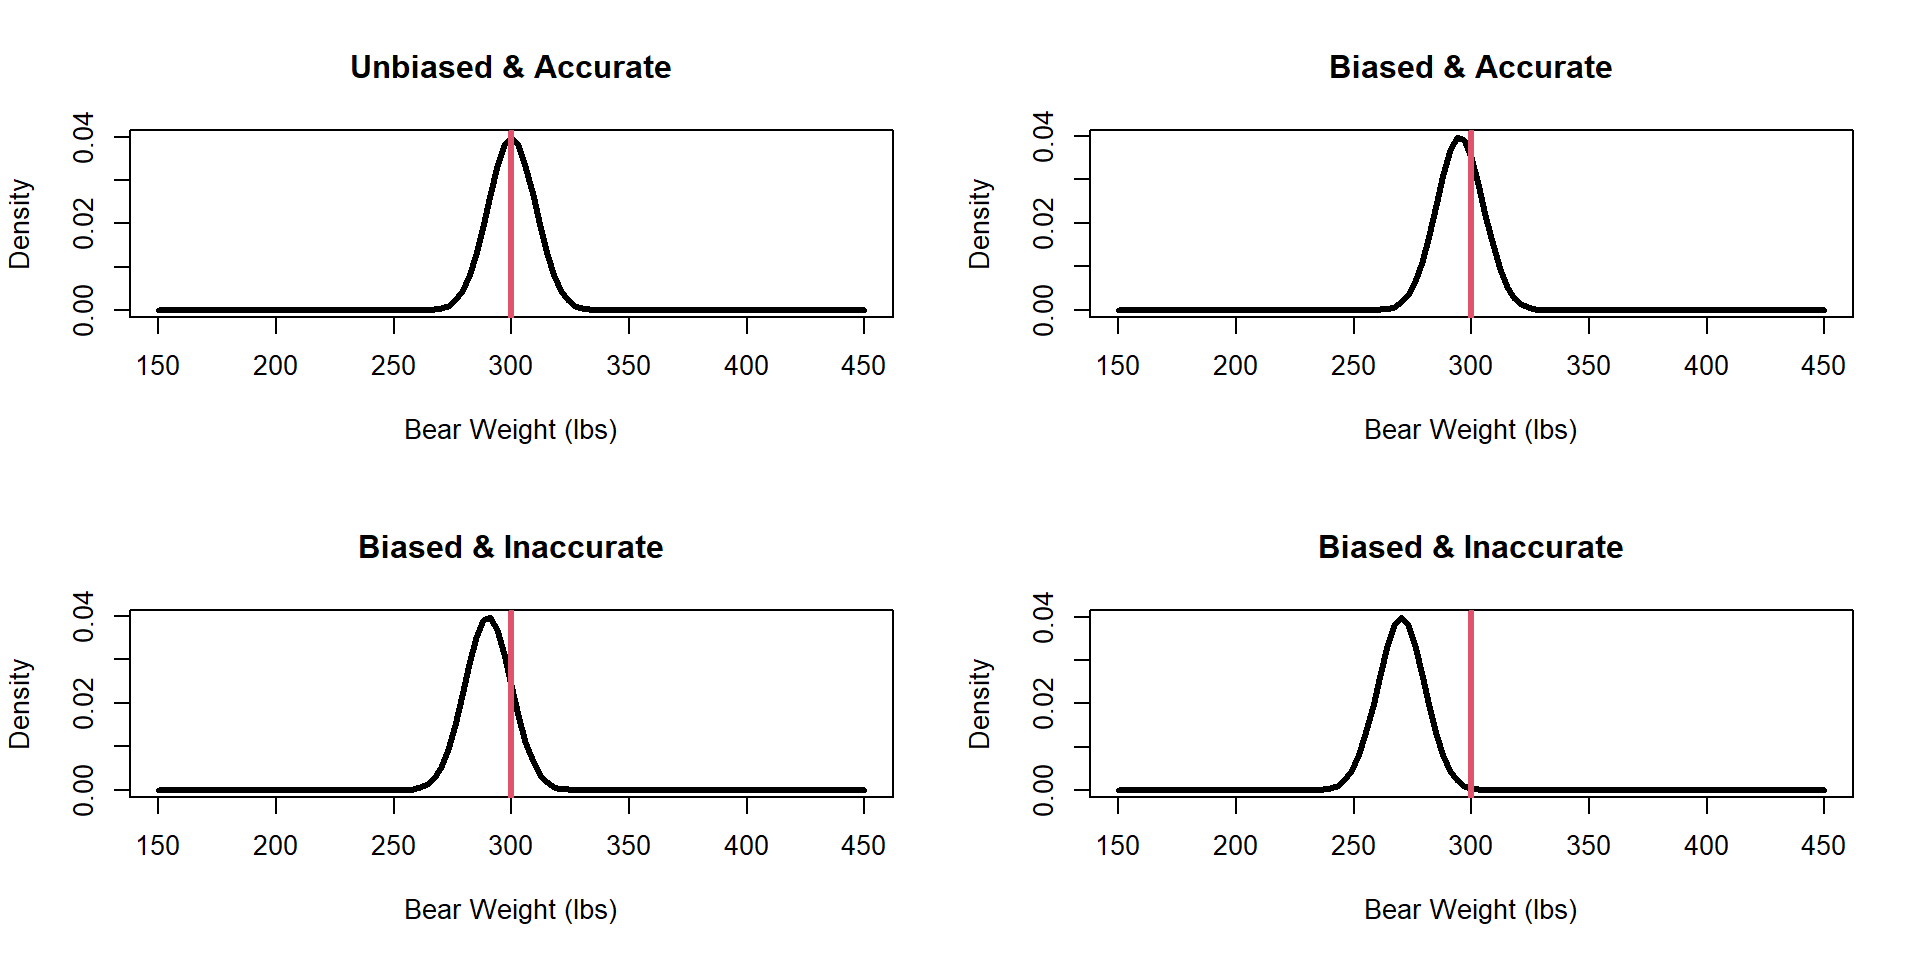
Accuracy A measure of how close the average sample value is to truth
Sampling Variation Which sampling distribution would you prefer?
Estimator Consistency An estimator of a parameter is consistent if it converges in probability to the true value of the parameter as the sample size tends to infinity.
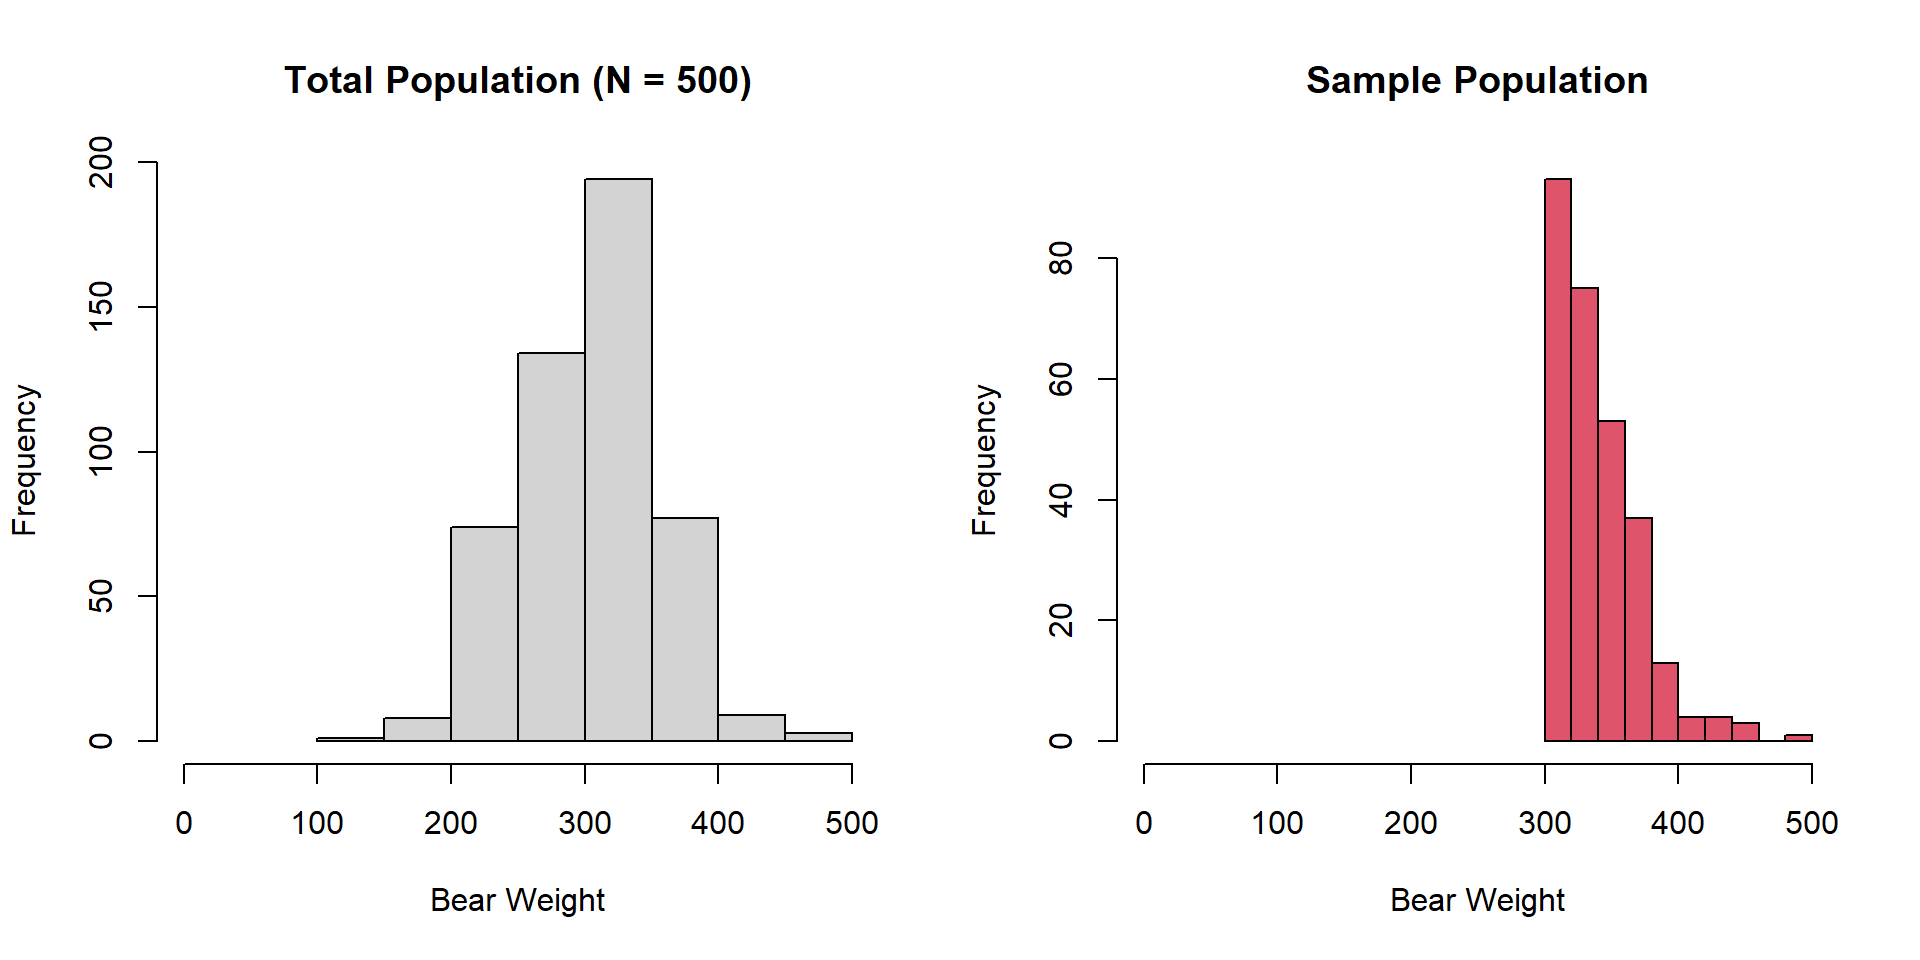
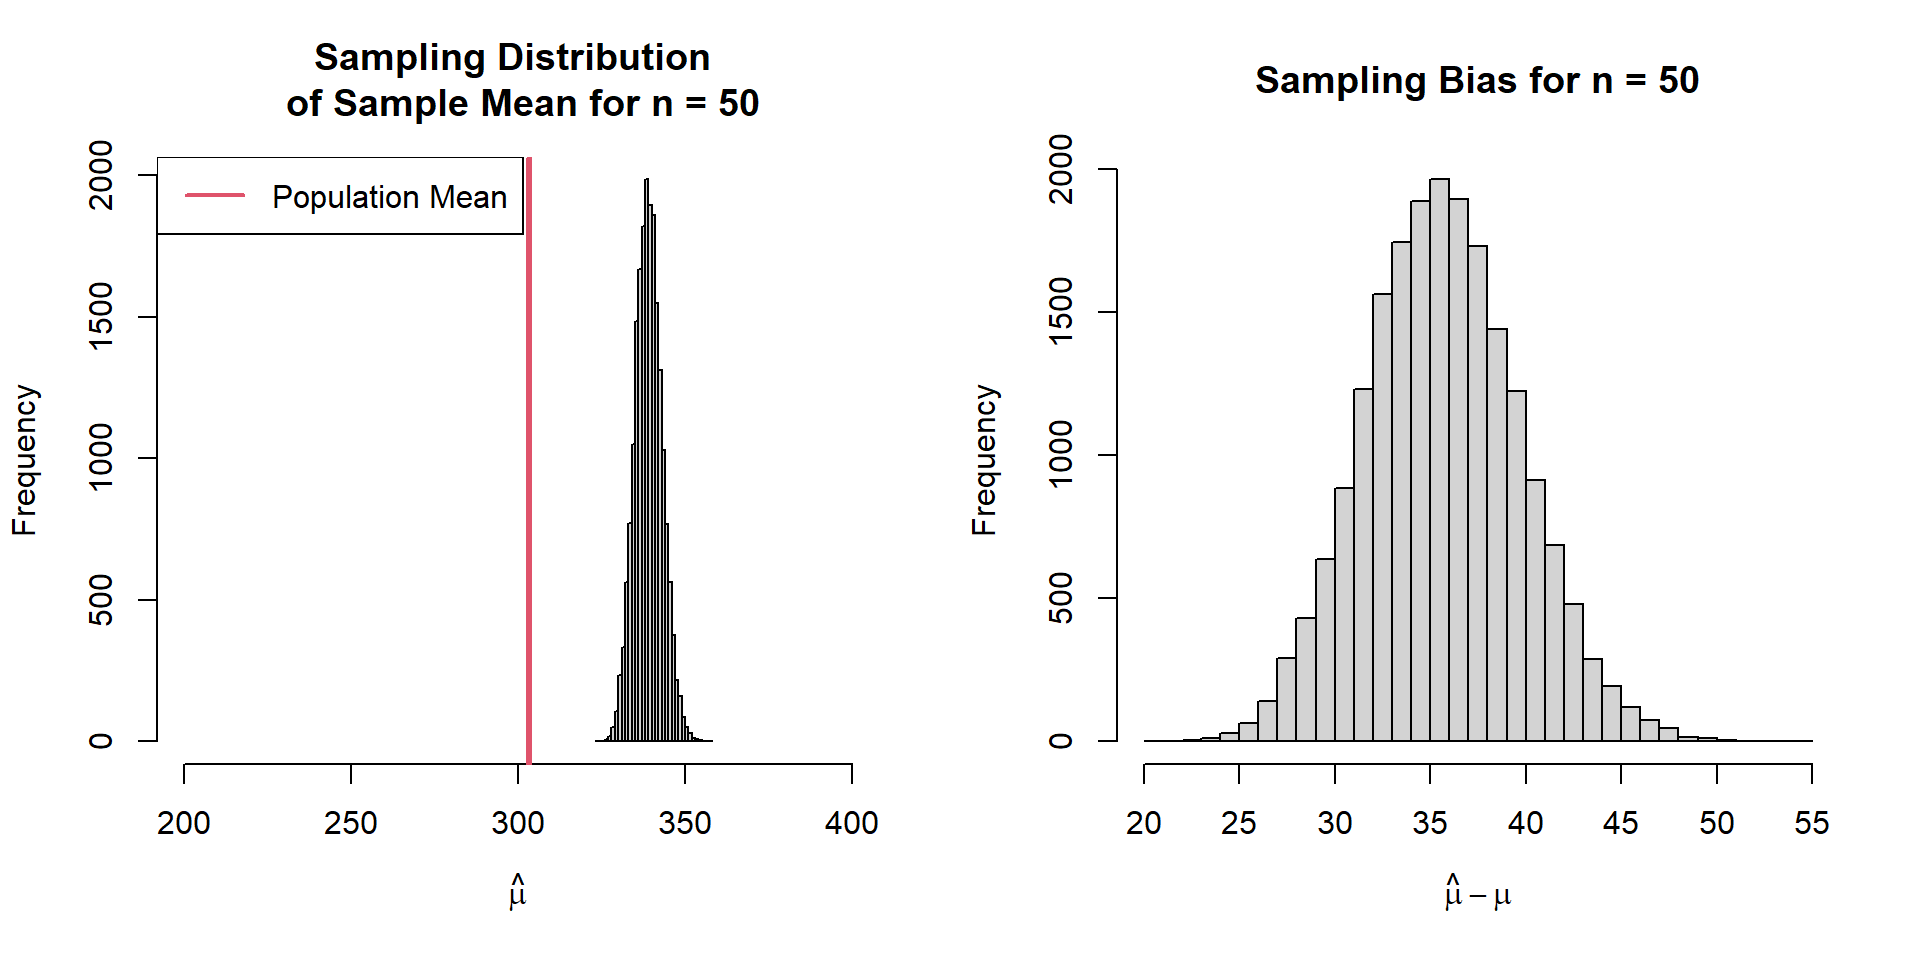
Sampling Bias
Sampling Bias
Systematic tendency of selecting certain sample units; makes the samples unrepresentative to the target population
Examples in fish/wildlife??
Sampling Bias Sample Population: Weight of harvested black bears in a region that allows food provisioning
Sampling Error and Bias
Sampling Bias We only sample harvested bears with food supplementation
Sampling Bias Relative Expected Bias = \(\frac{E(\hat{\mu})-\mu}{\mu}\)
Relative Expected Bias = 0.12
Biased Estimator We sample all bears but use a different estimator for the population mean
\[
\hat{\mu} = \left(\sum_{i=1}^{n}(y_{i})^{0.38}\right)\times \frac{1}{n^{1/10000}}
\]
Biased Estimator Expected Bias = 14.87
Measurement Error Didn’t zero the scale before weighing; this is not sampling error.
Measurement Error Inaccurate measurements due to malfunctioning instruments or poor procedures or by-product of sampling plan
E.g.,
In Aspen, CO human-bear conflicts tend to be under reported
In New Jersey they tend to be over reported
Summary
census
inference
sample
sample unit
sample size
sampling error
sampling variation
sample parameter
sampling frame
sampling bias
sampling distribution
target population / population
population parameter
design vs model-based inference
vector
statistic
estimator
estimate
estimator bias
accuracy / bias / precision
estimator consistency
measurement error