Proportions
Proportions
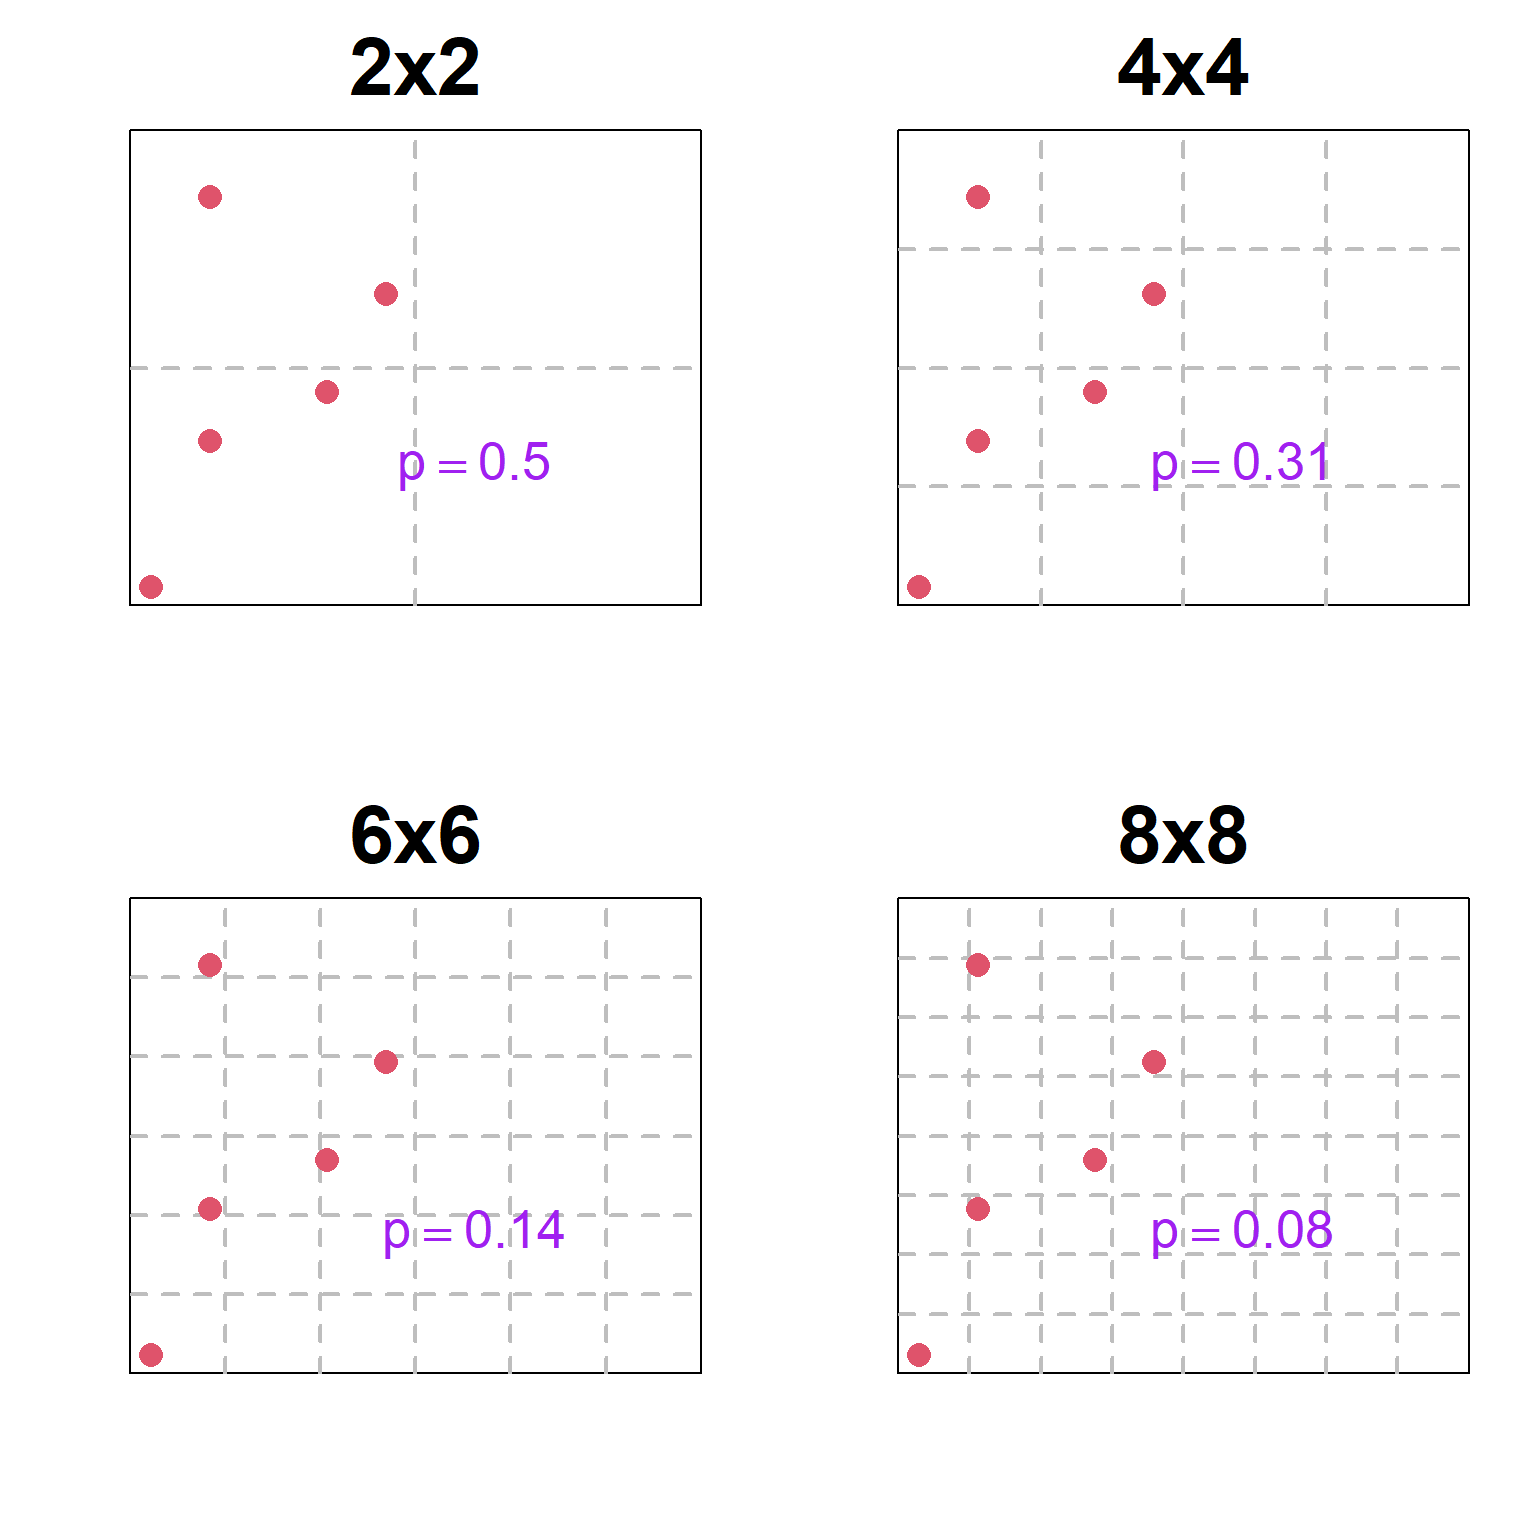
Strong Interest in fish/wildlife
Examples?
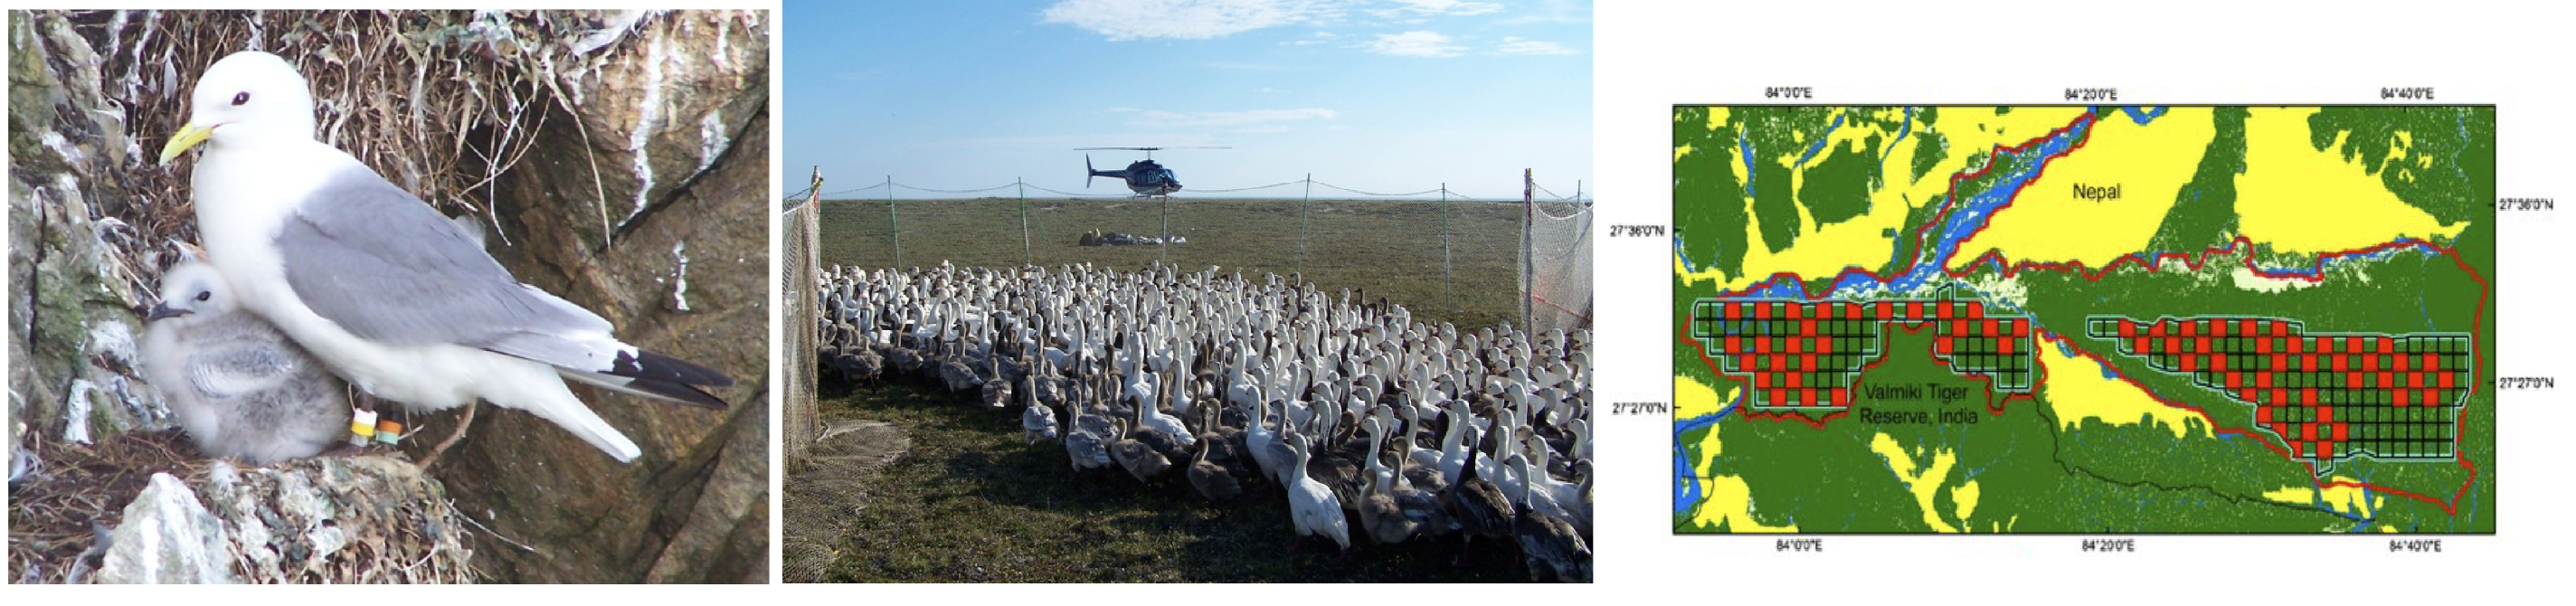
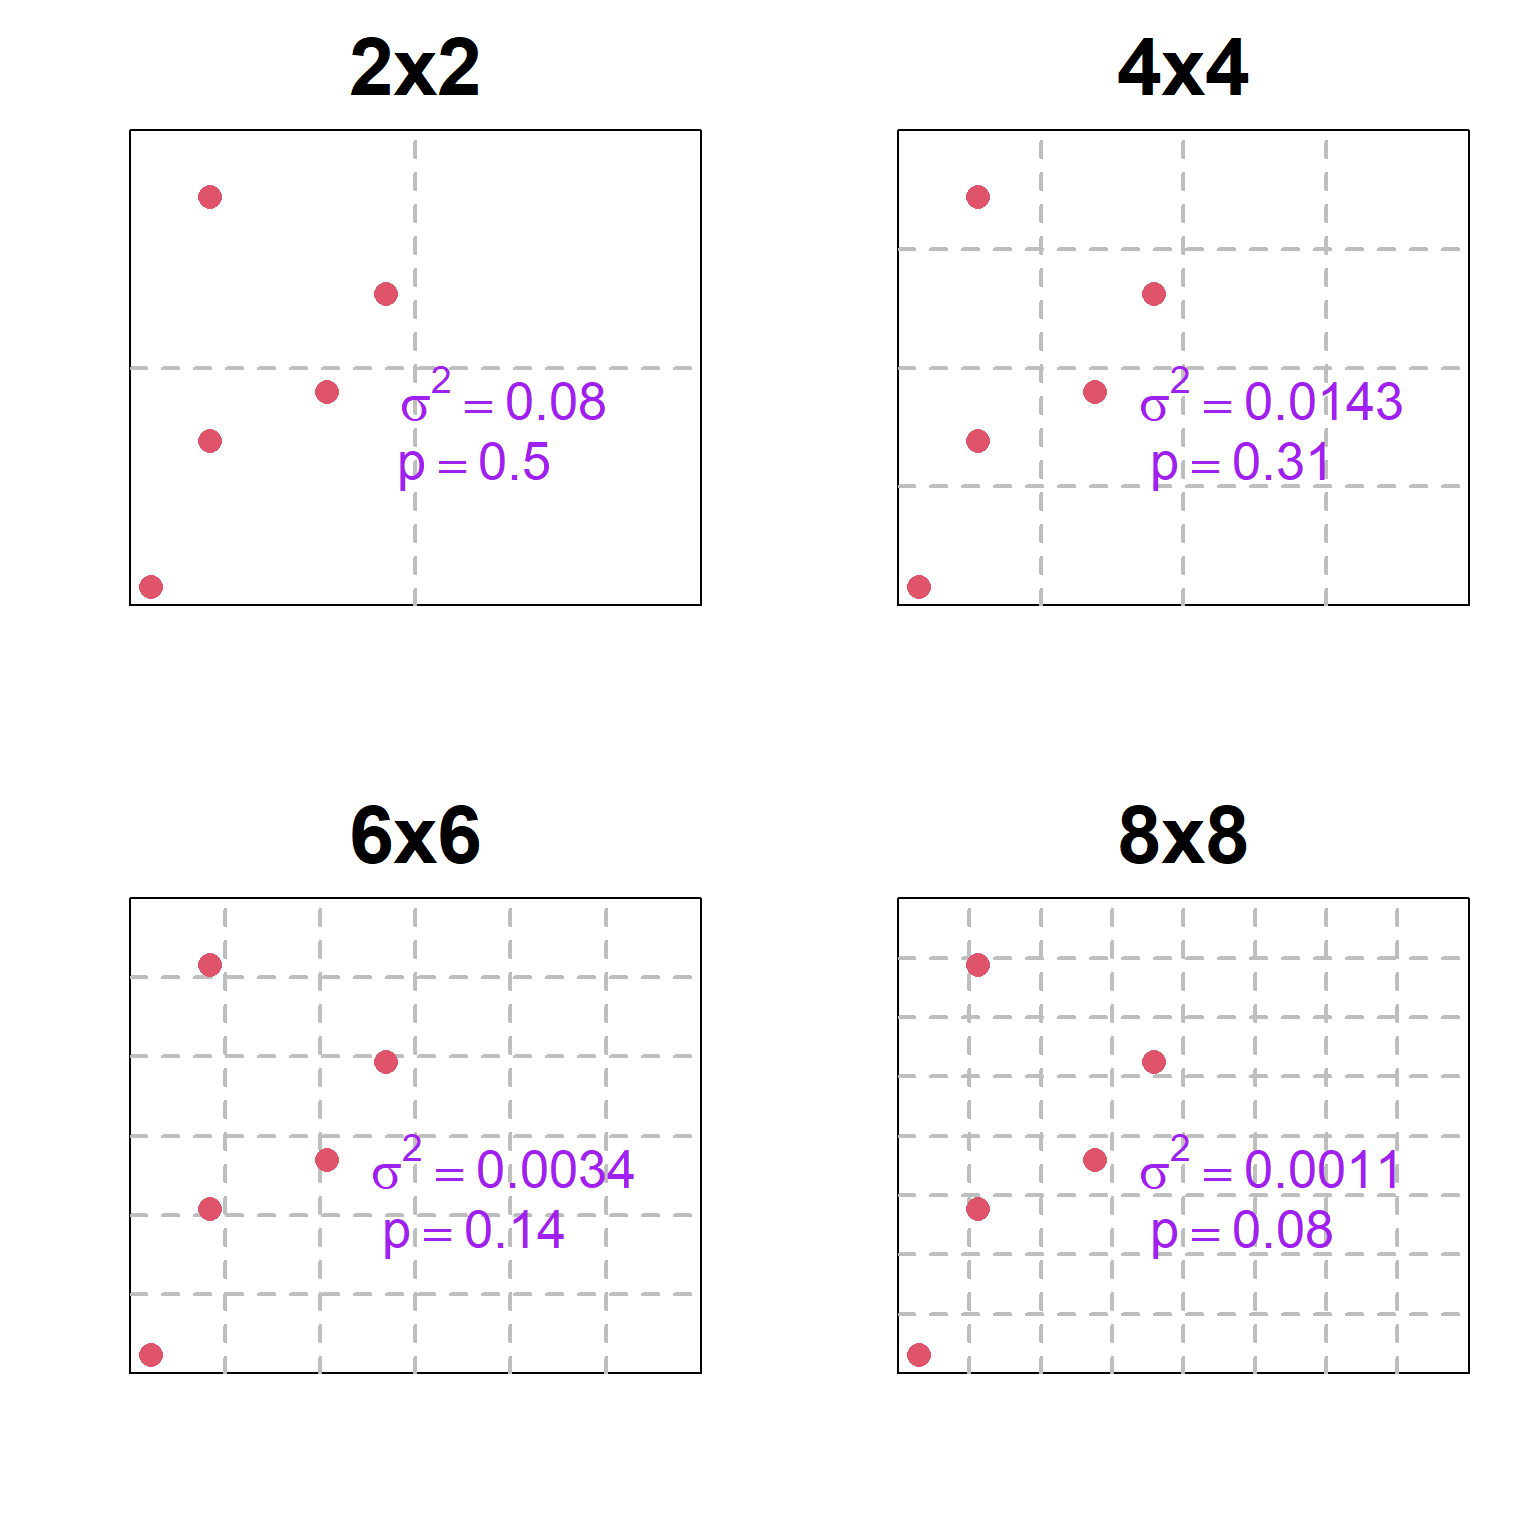
Proportion area occupied
How does sample grid effect \(\hat{p}\) and \(\hat{\sigma}^2_{p}\)?
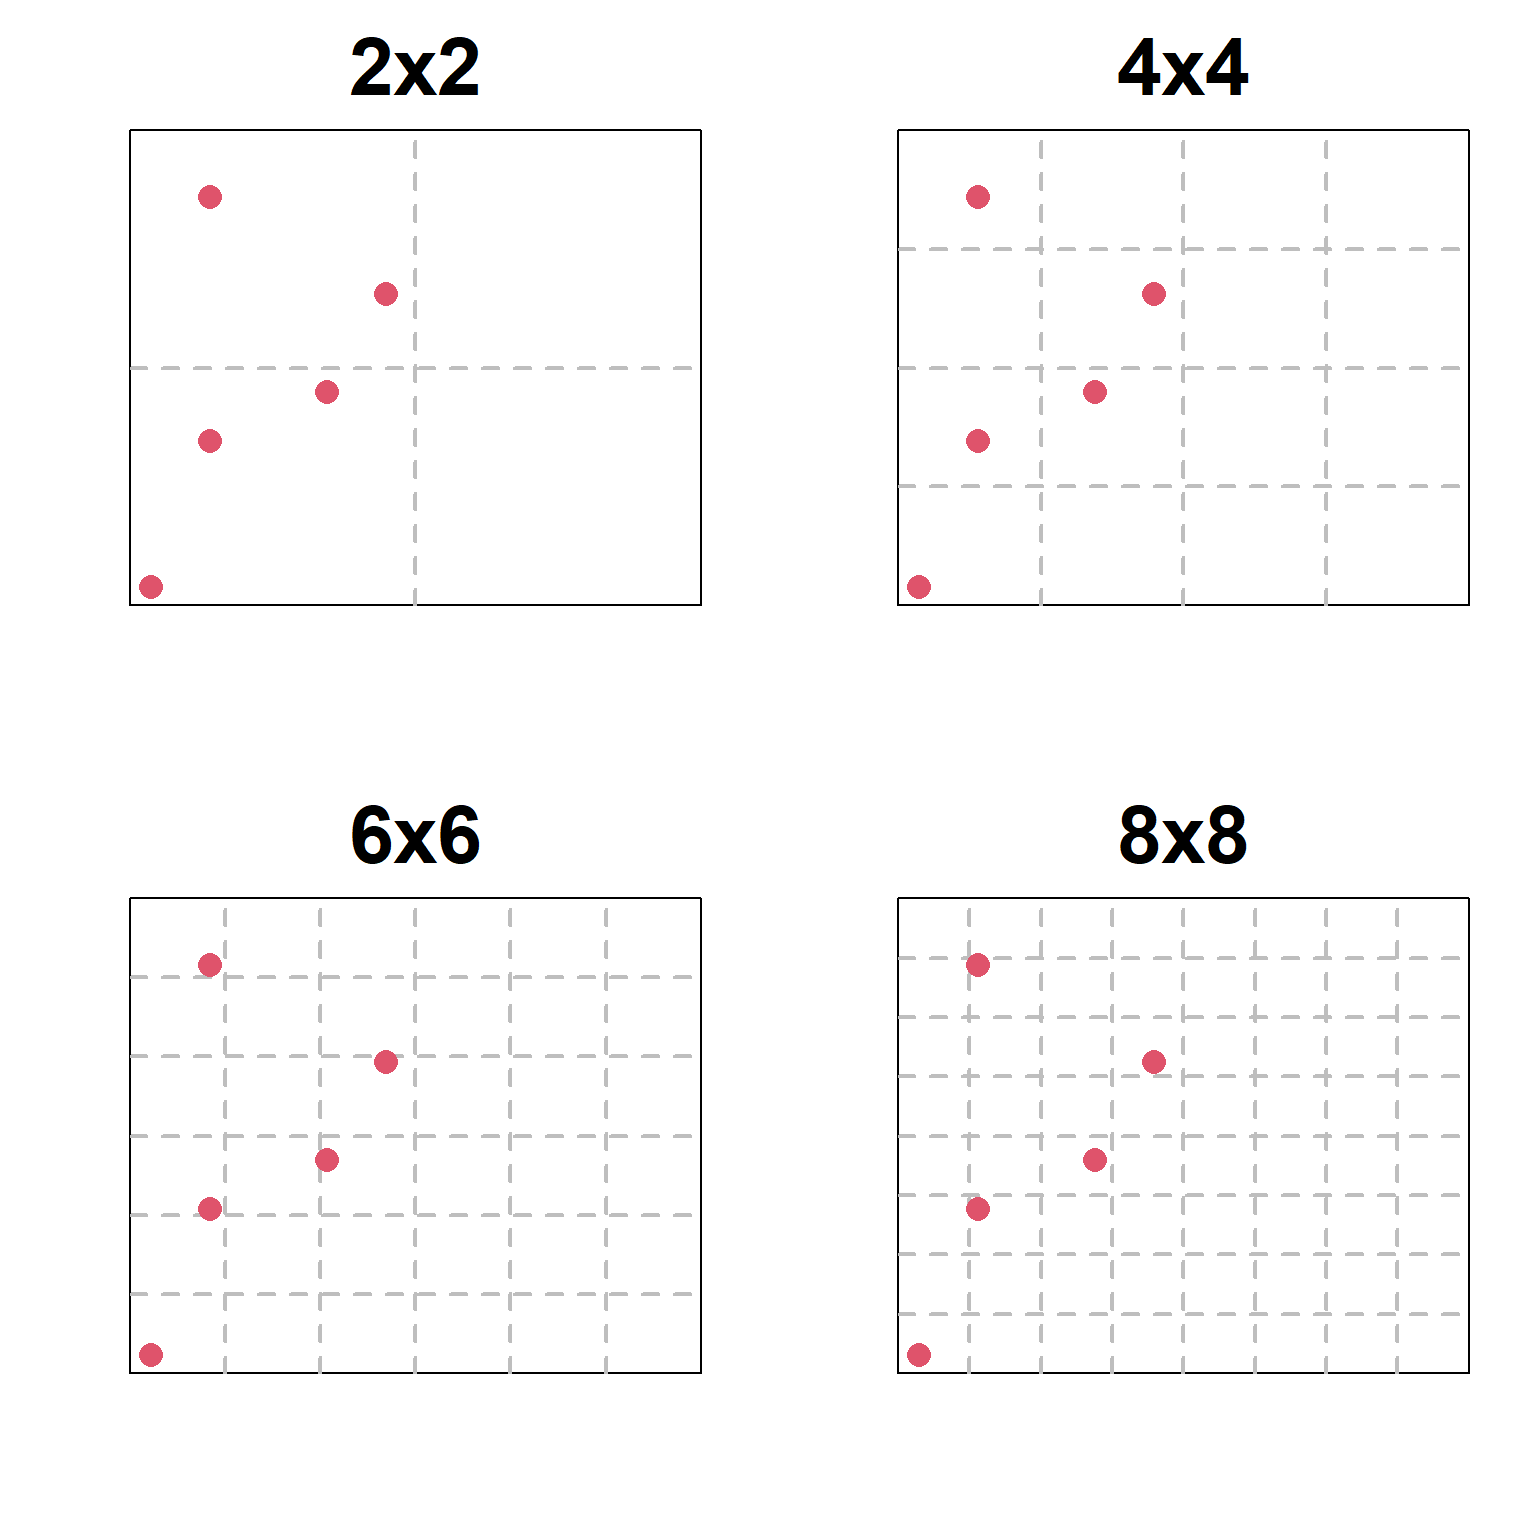
Proportion area occupied
How does sample grid effect \(\hat{p}\) and \(\hat{\sigma}^2_{p}\)?
Proportion area occupied
How does sample grid effect \(\hat{p}\) and \(\hat{\sigma}^2_{p}\)?
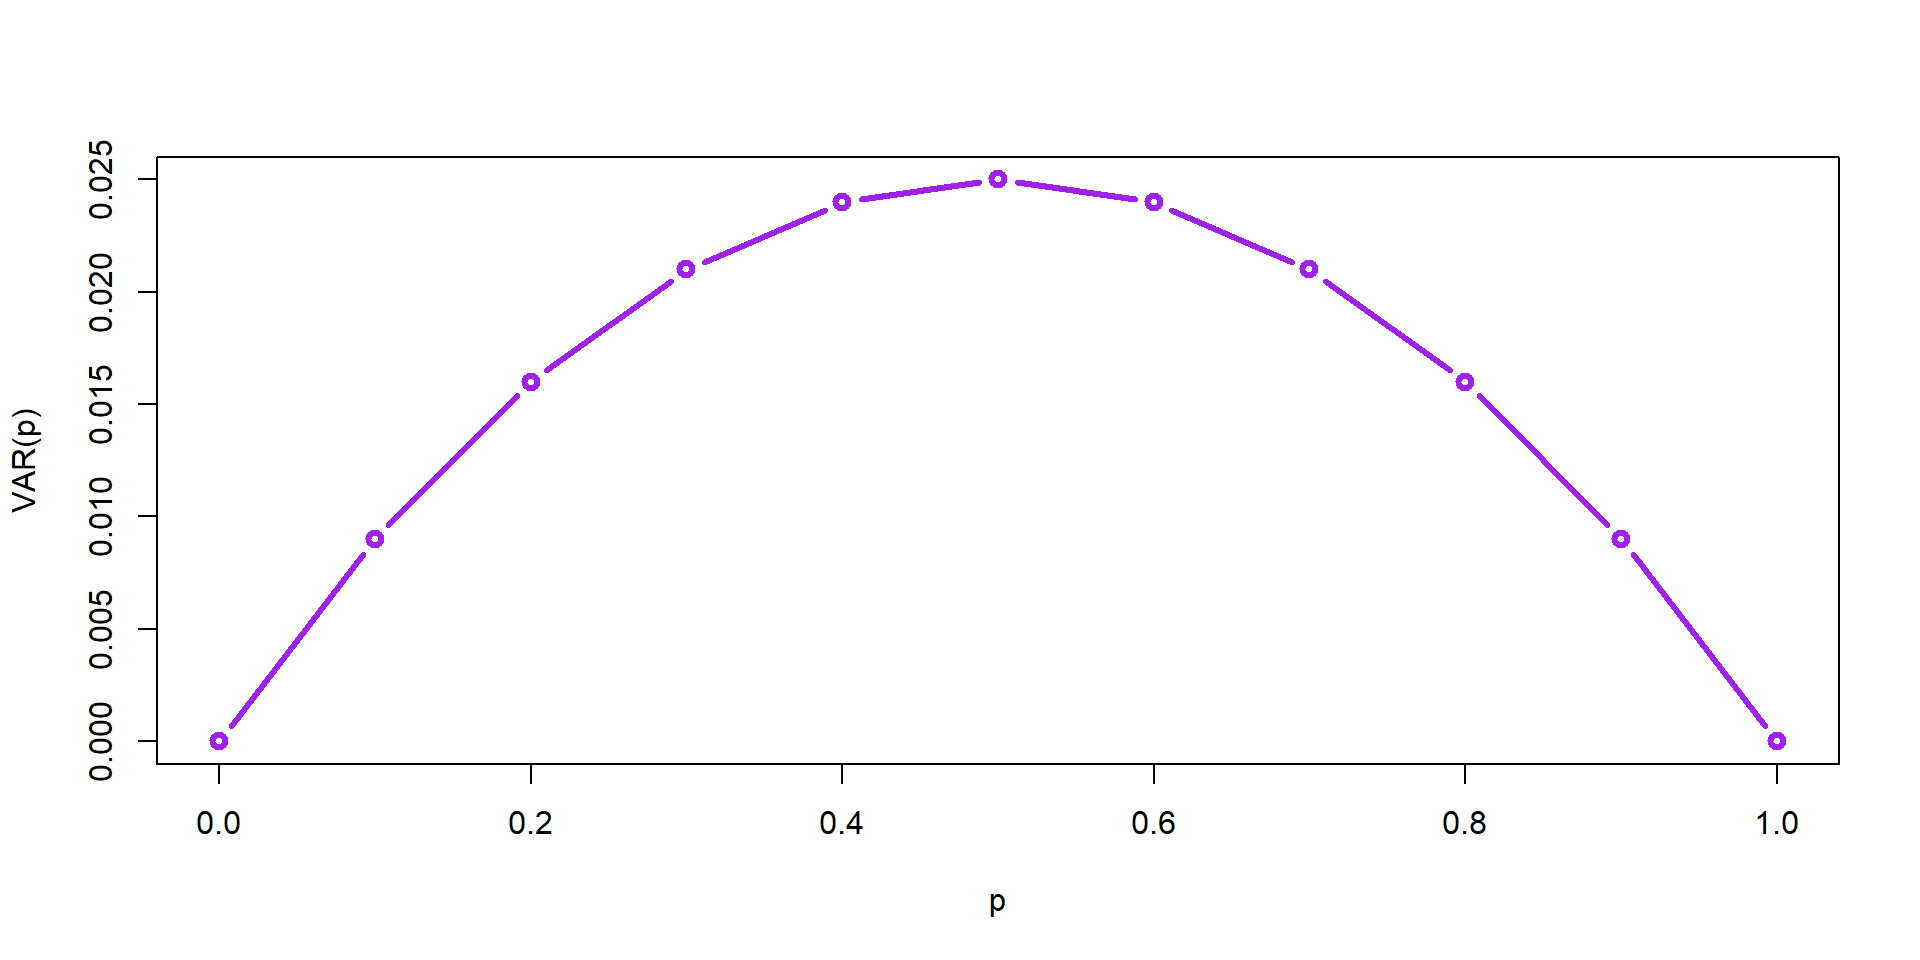
Var(p)
Does this make sense?
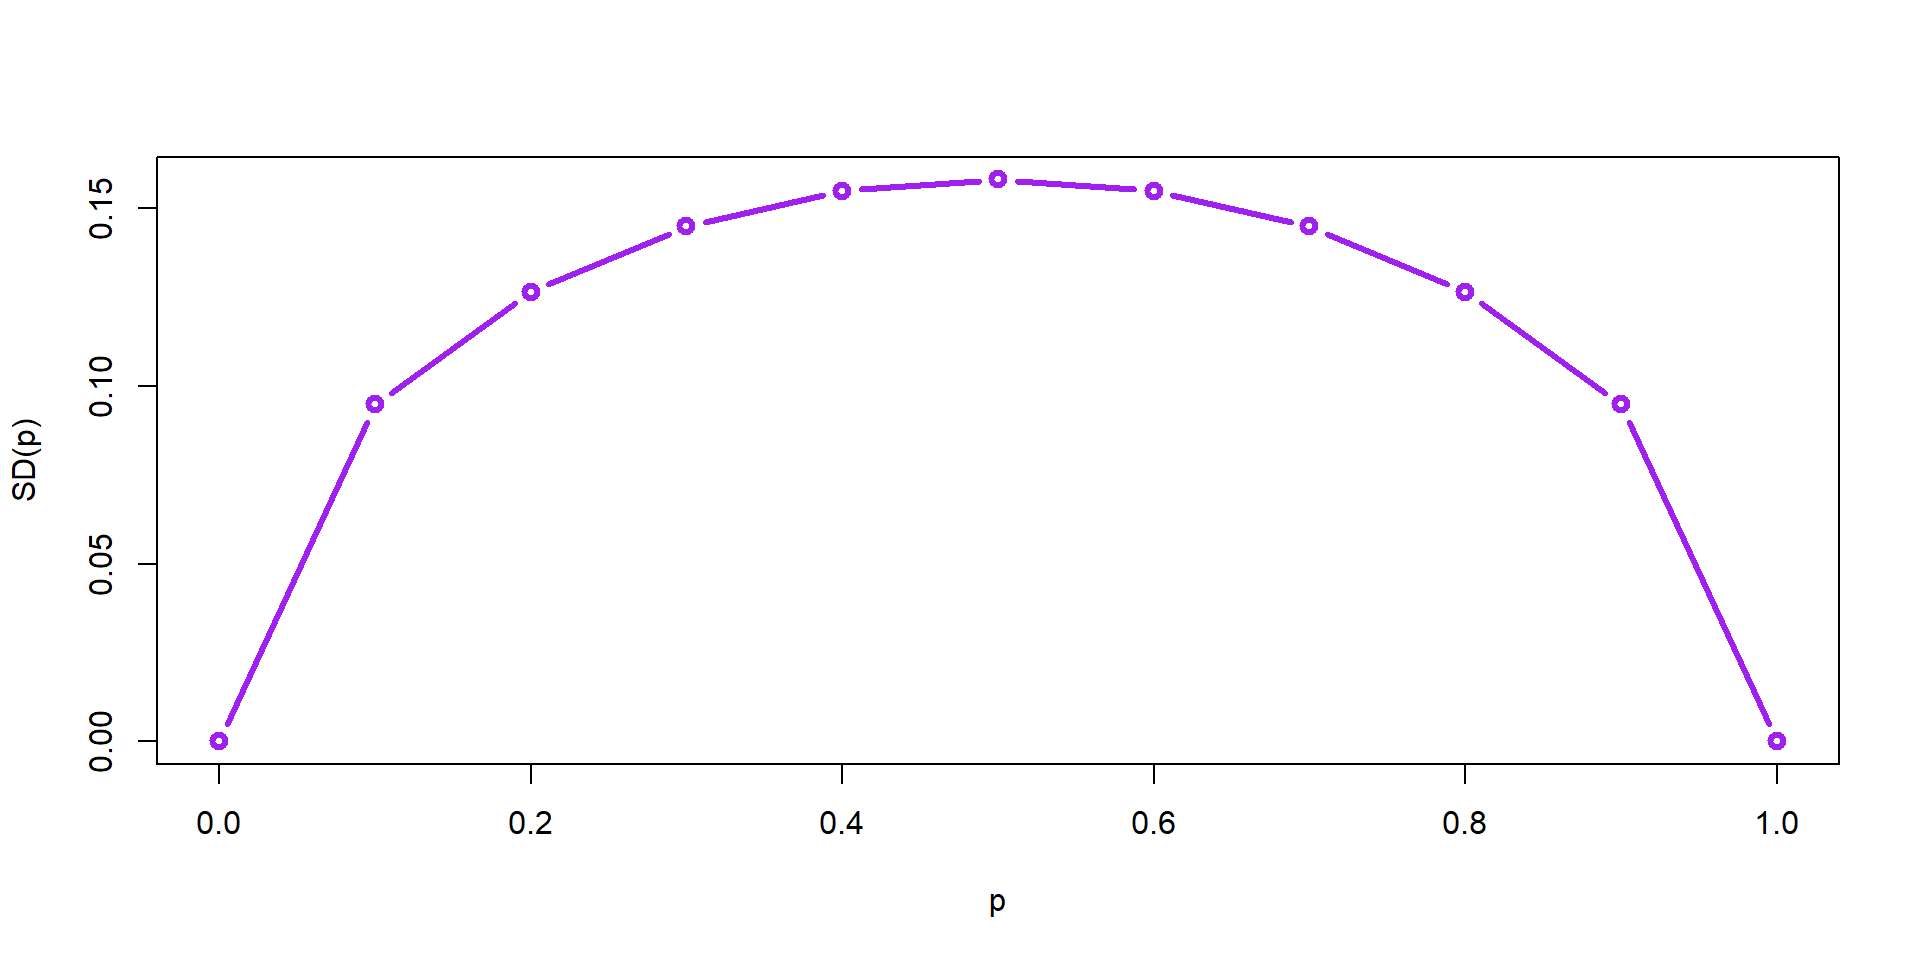
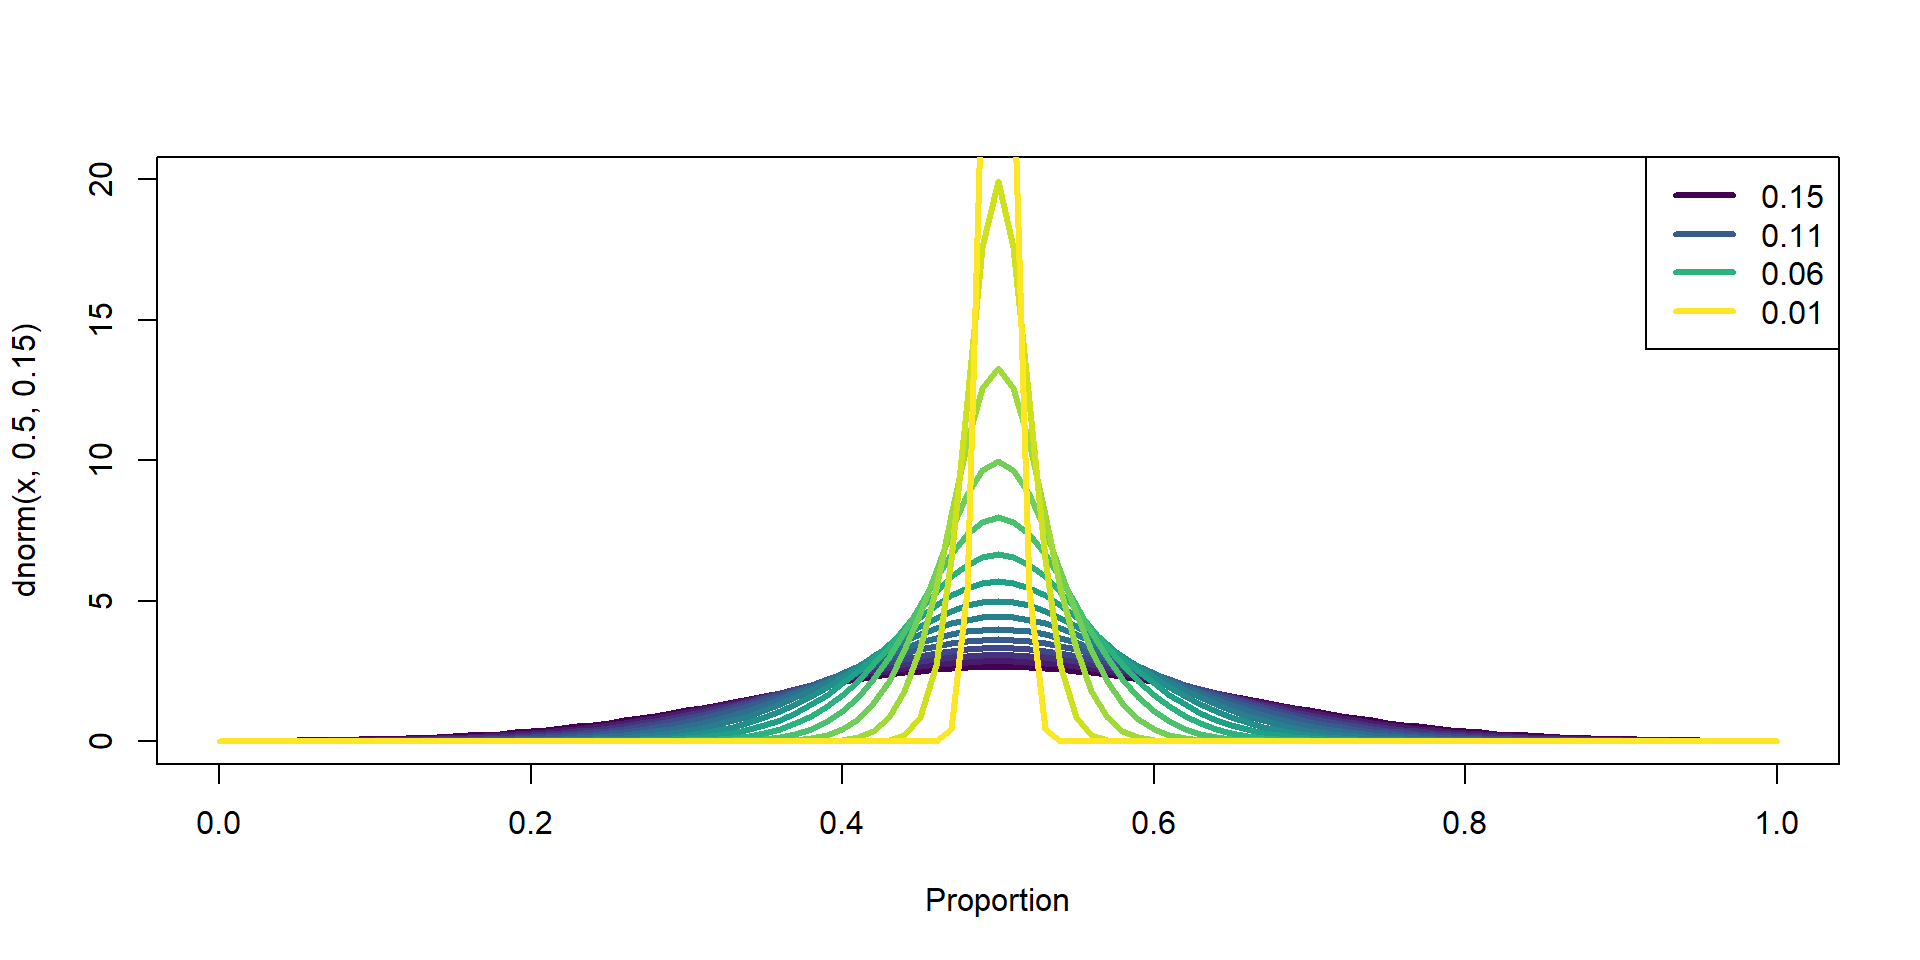
SD(p)
Lets visualize a few standard deviations of p
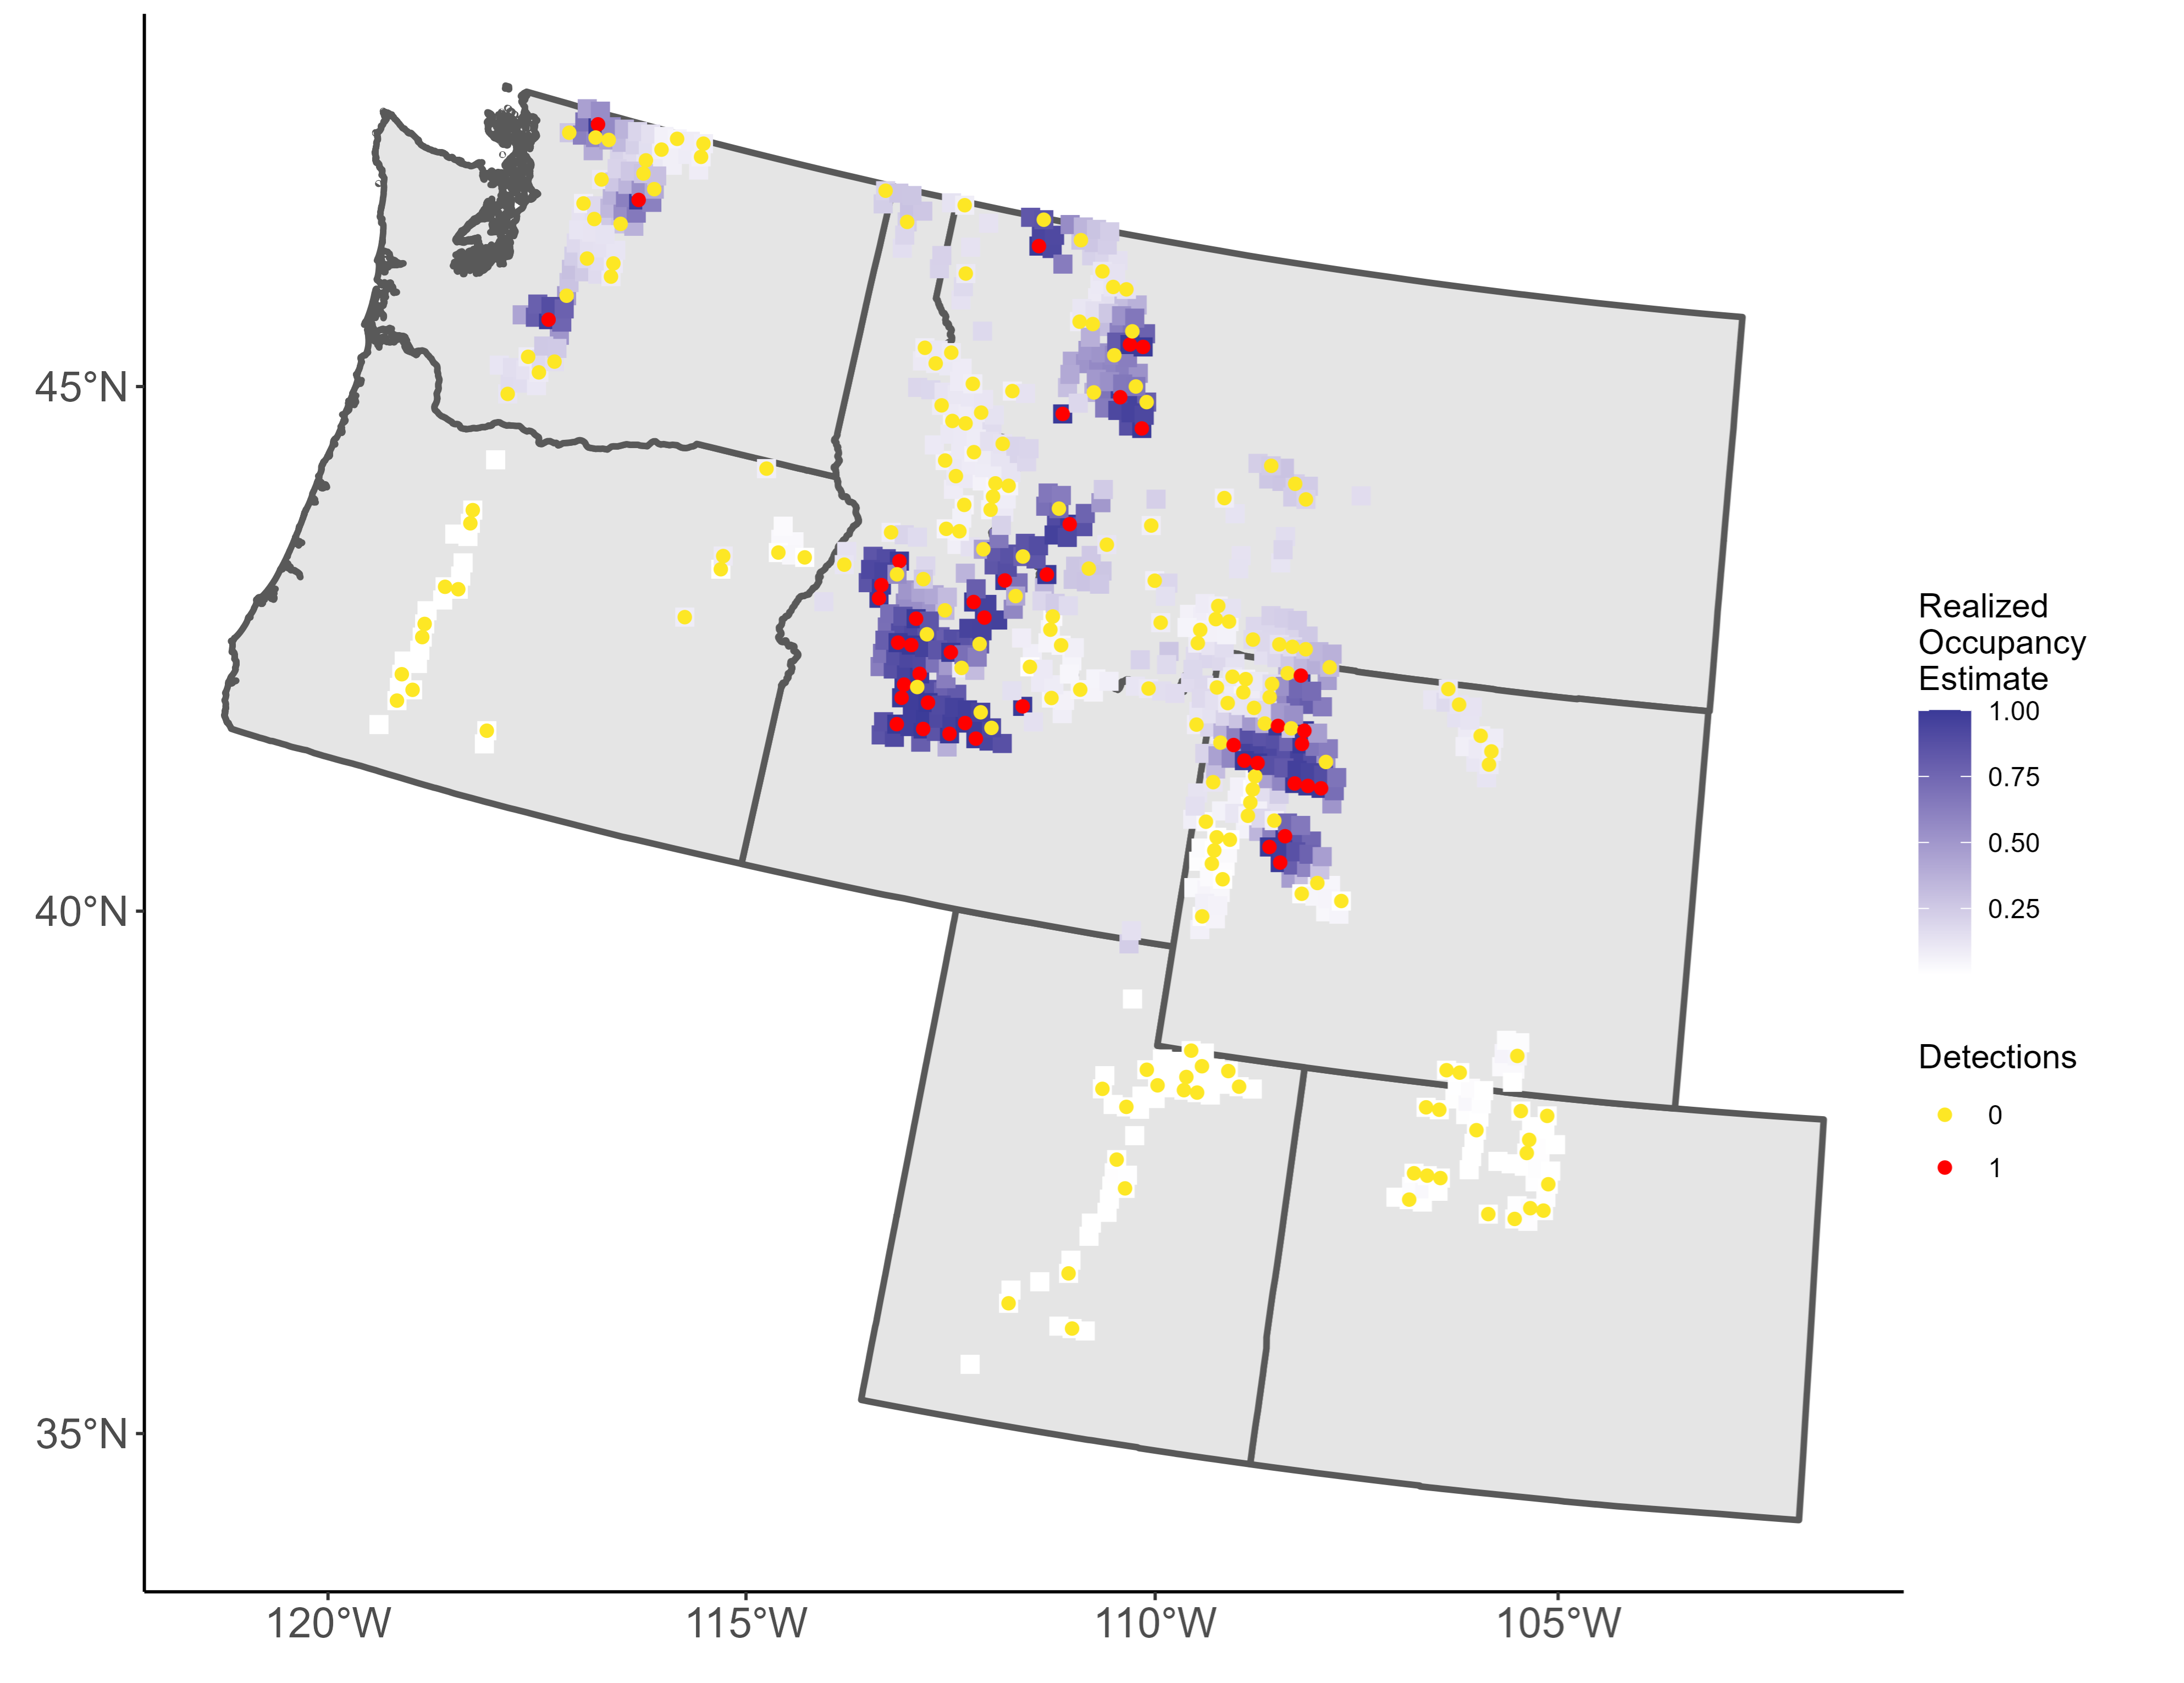
Wolverine Monitoring
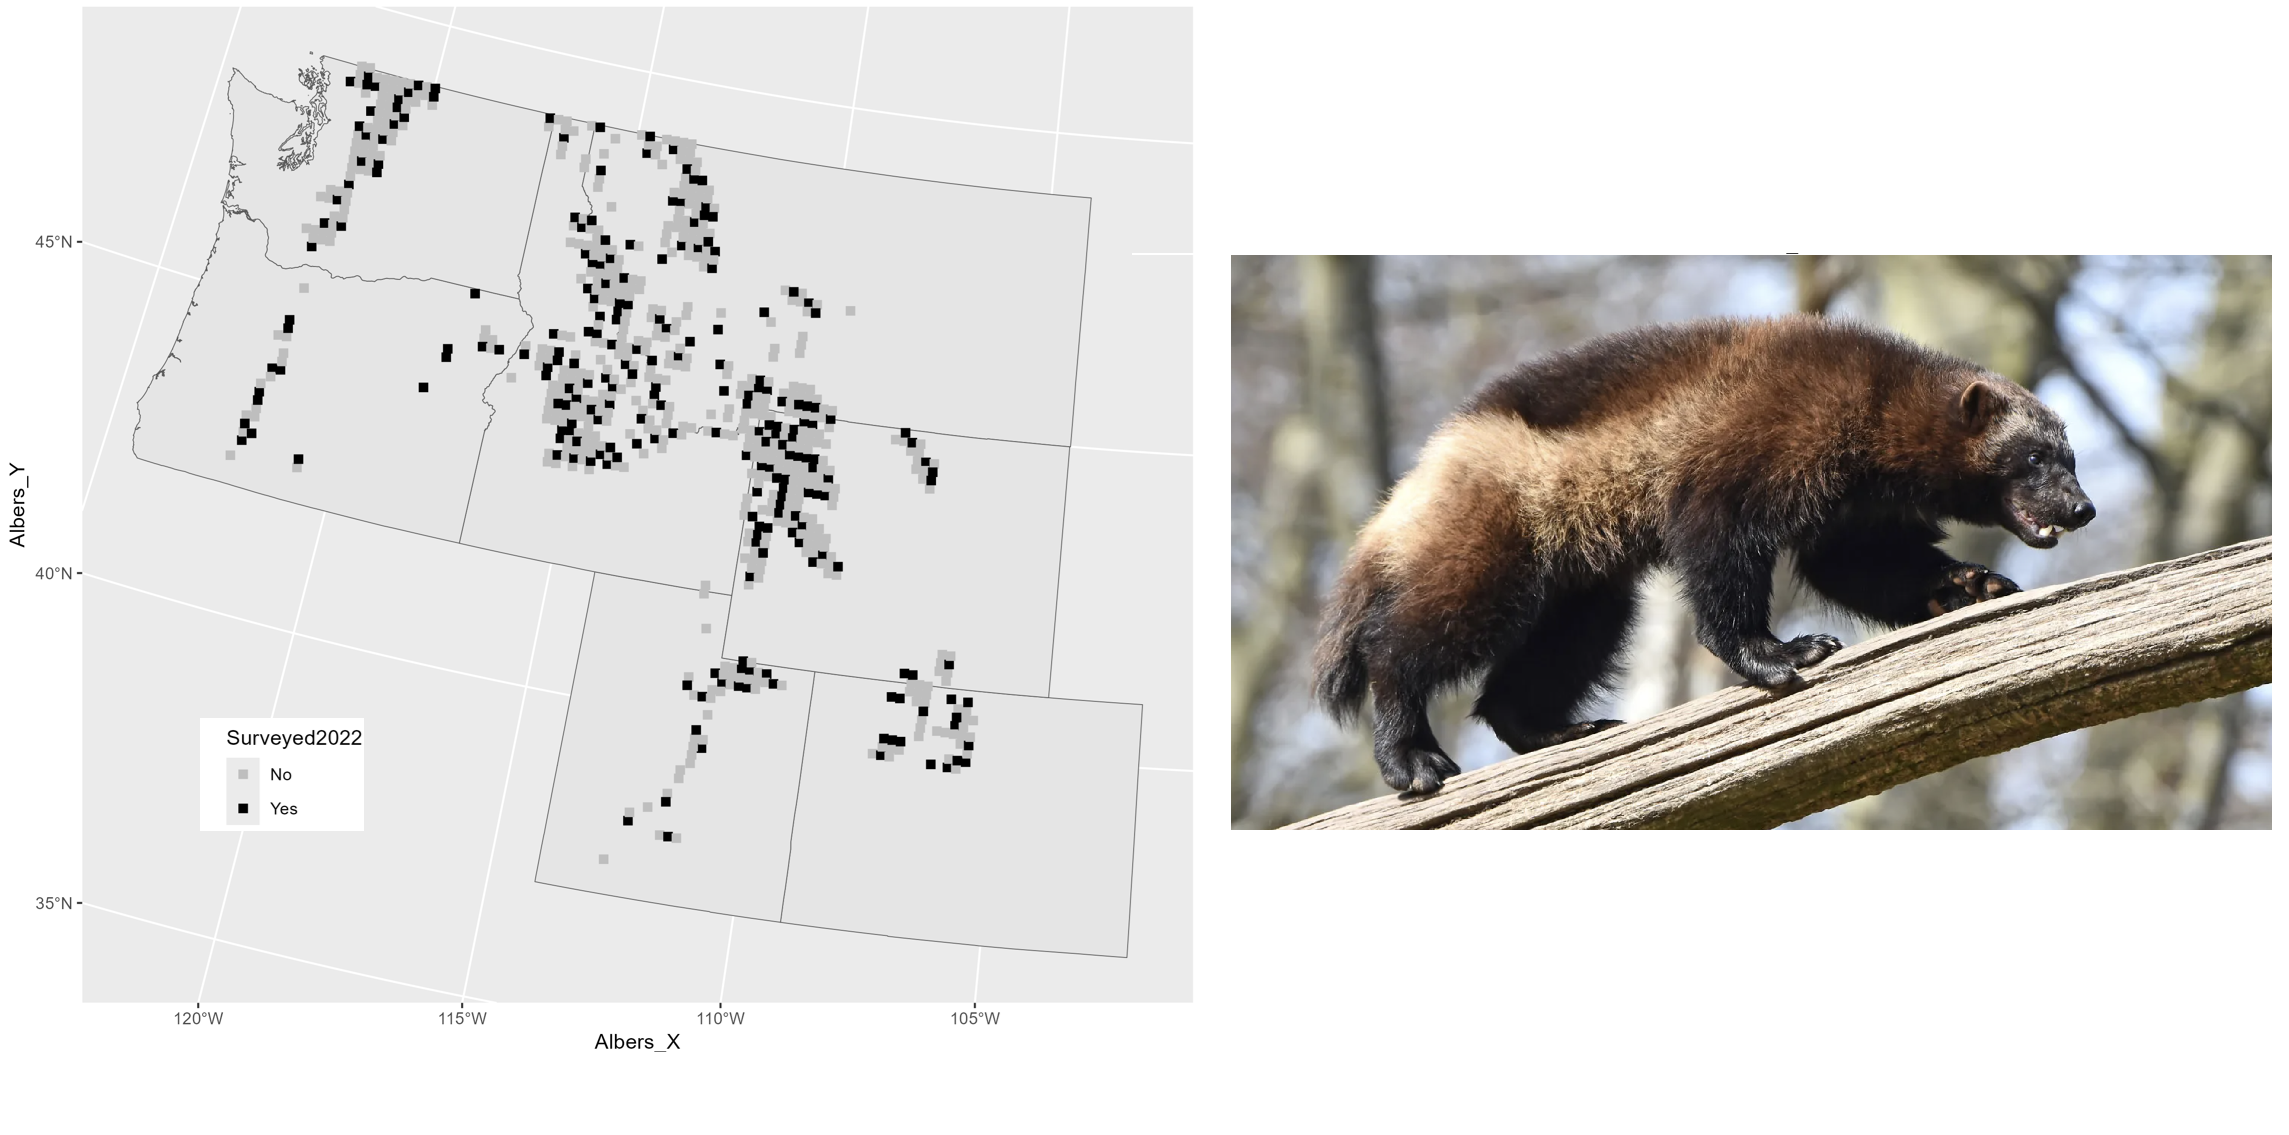
SRS
Sampling Distribution of \(\hat{p}\)
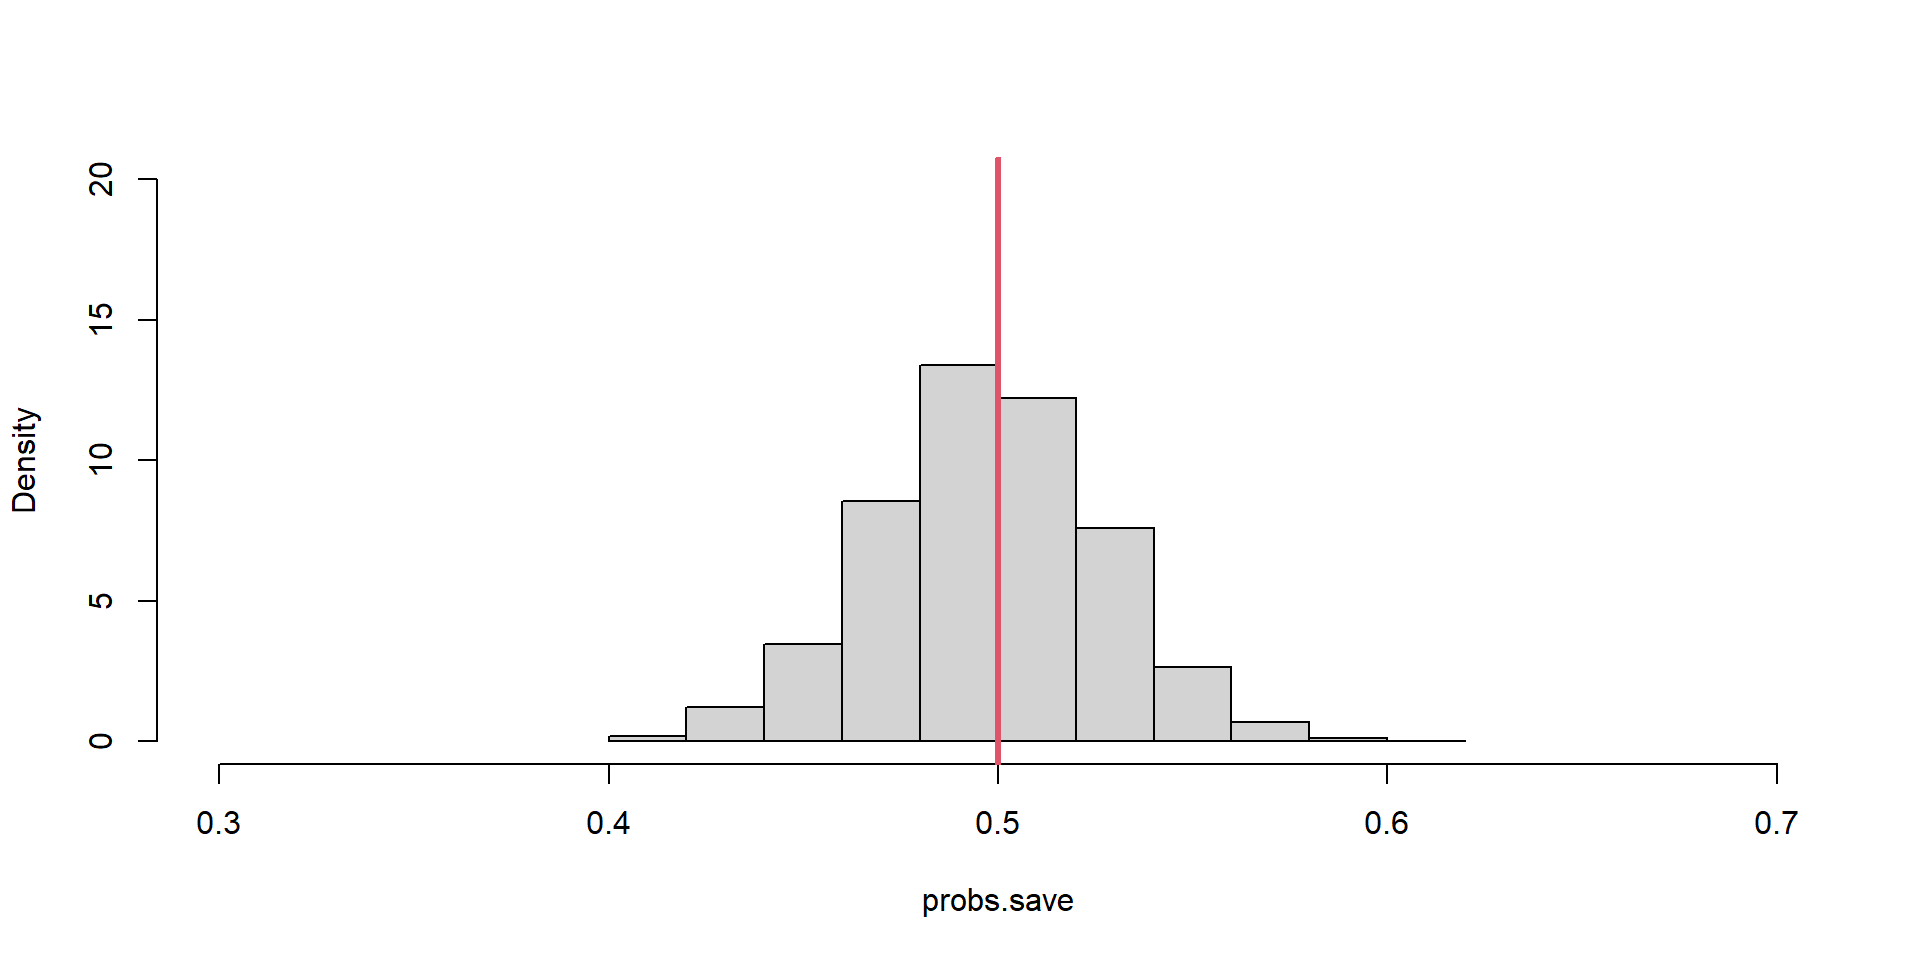
Estimator Bias = -0.00005
Distribution Var = 0.00084
Ancillary Occurences
SRS of n = 200 with 5% ancillary and occupied sites
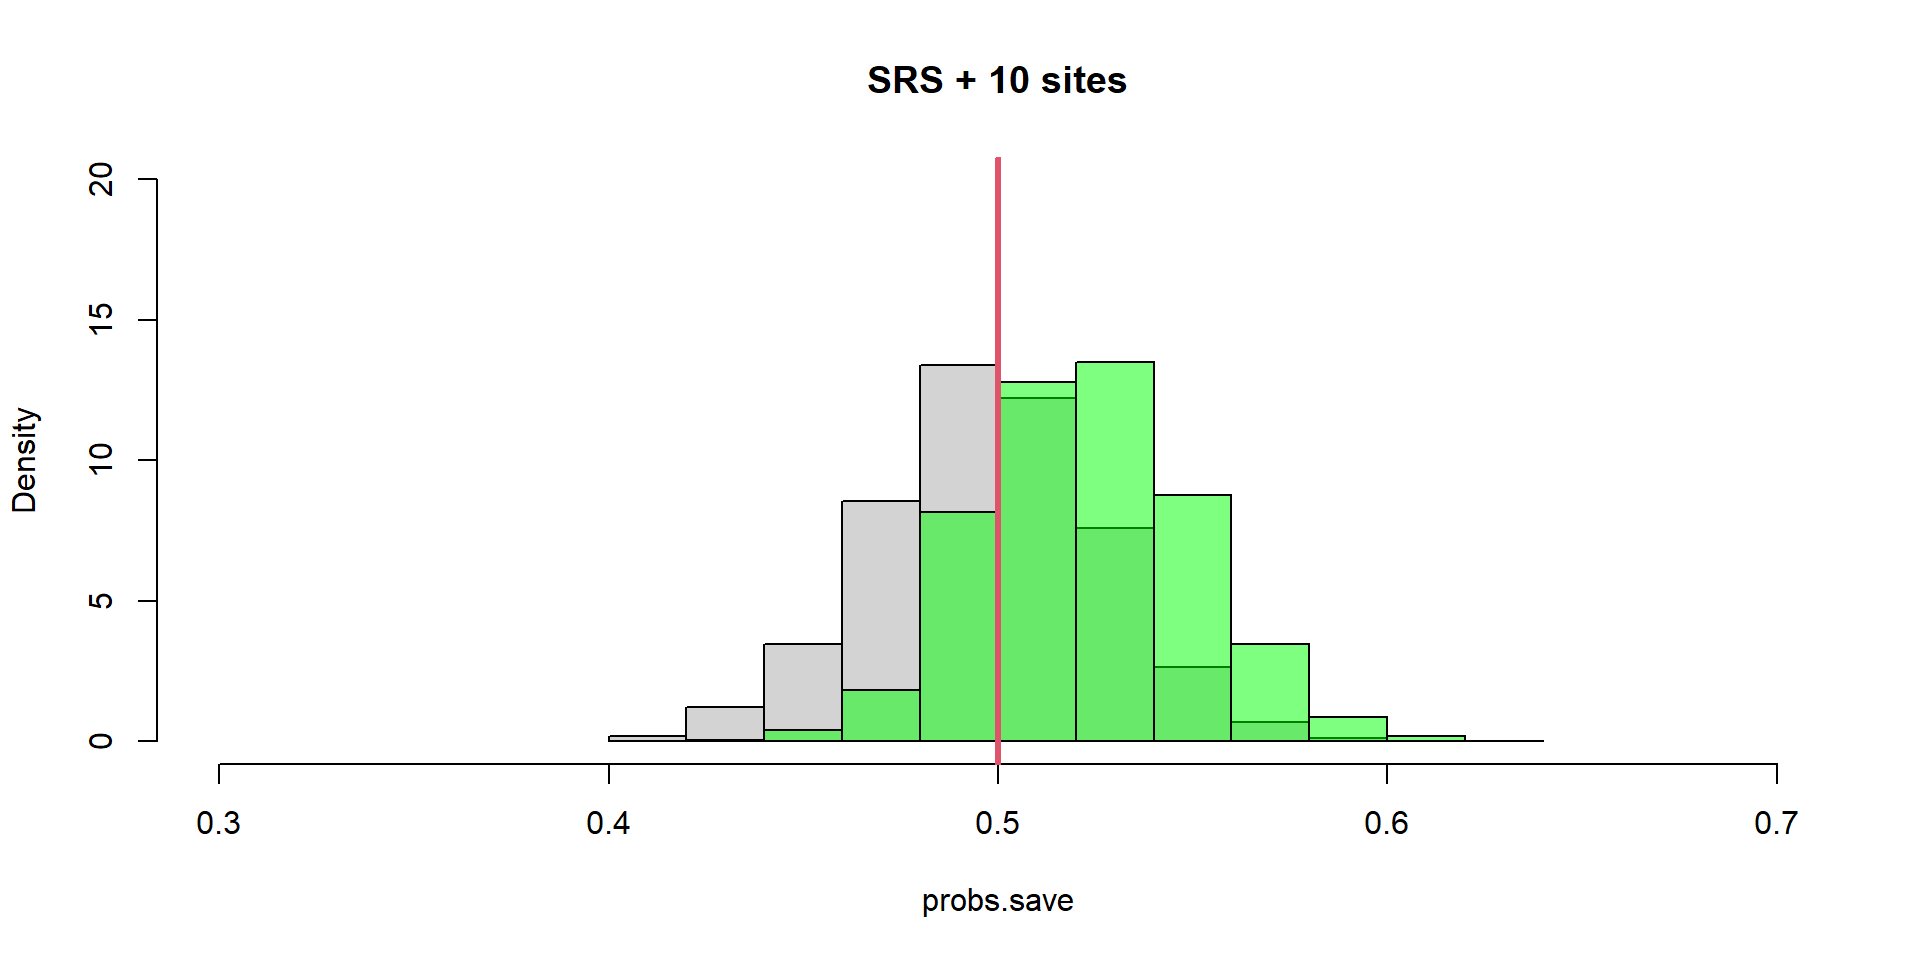
Estimator Bias = 0.02382
Distribution Var = 0.00073
Ancillary Occurences
SRS of n = 200 with 10% ancillary and occupied sites
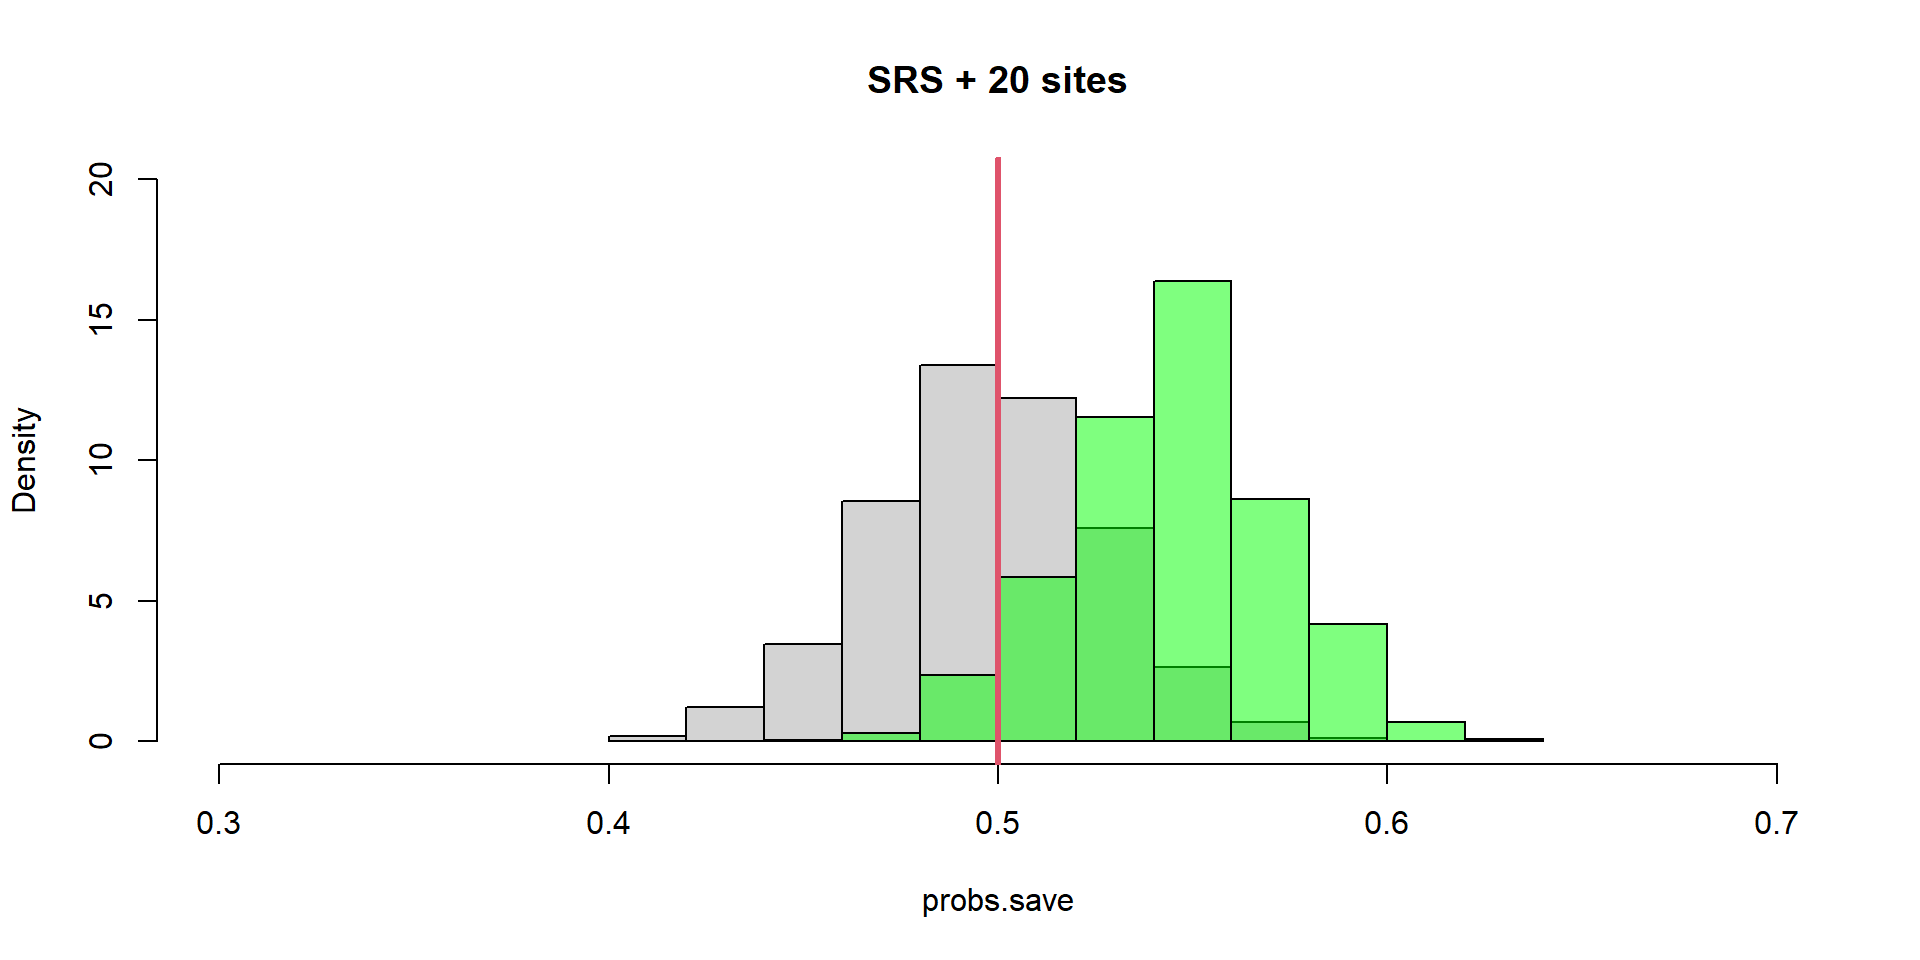
Estimator Bias = 0.04536
Distribution Var = 0.00069
My Wolverine ‘Problem’
Unequal Probability of Sampling
1/2 sites with 3x the probability of being sampled versus other half
samplefunction has an argumentprob
\[ \hat{p} = \frac{1}{n}\sum_{i=1}^{n}y_i \]
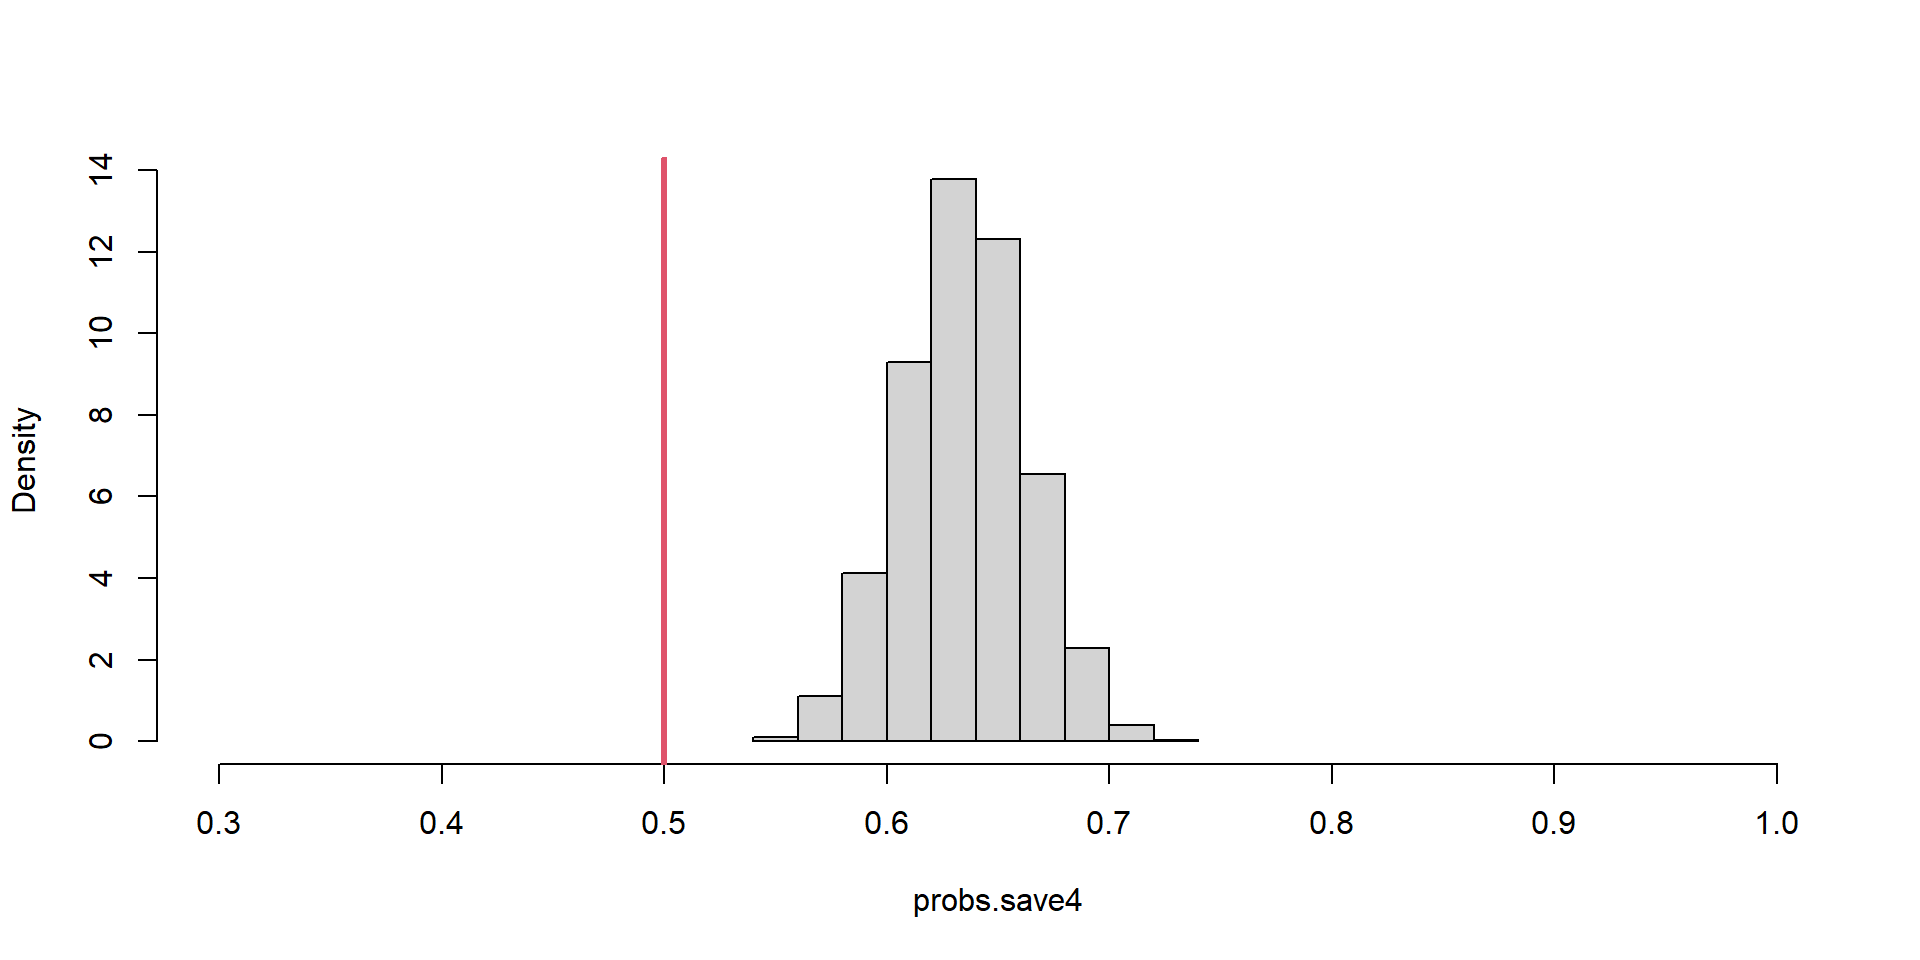
Estimator Bias = 0.13753
Unequal Probability of Sampling
Generalized Unequal Probability Estimator
Thompson Ch. 6.3
\[ \hat{\theta} = \frac{\sum_{i} y_i / \pi_i}{\sum_{i}1 / \pi_i} \]
- \(\pi_{i}\) = probability of selecting sample \(i\).
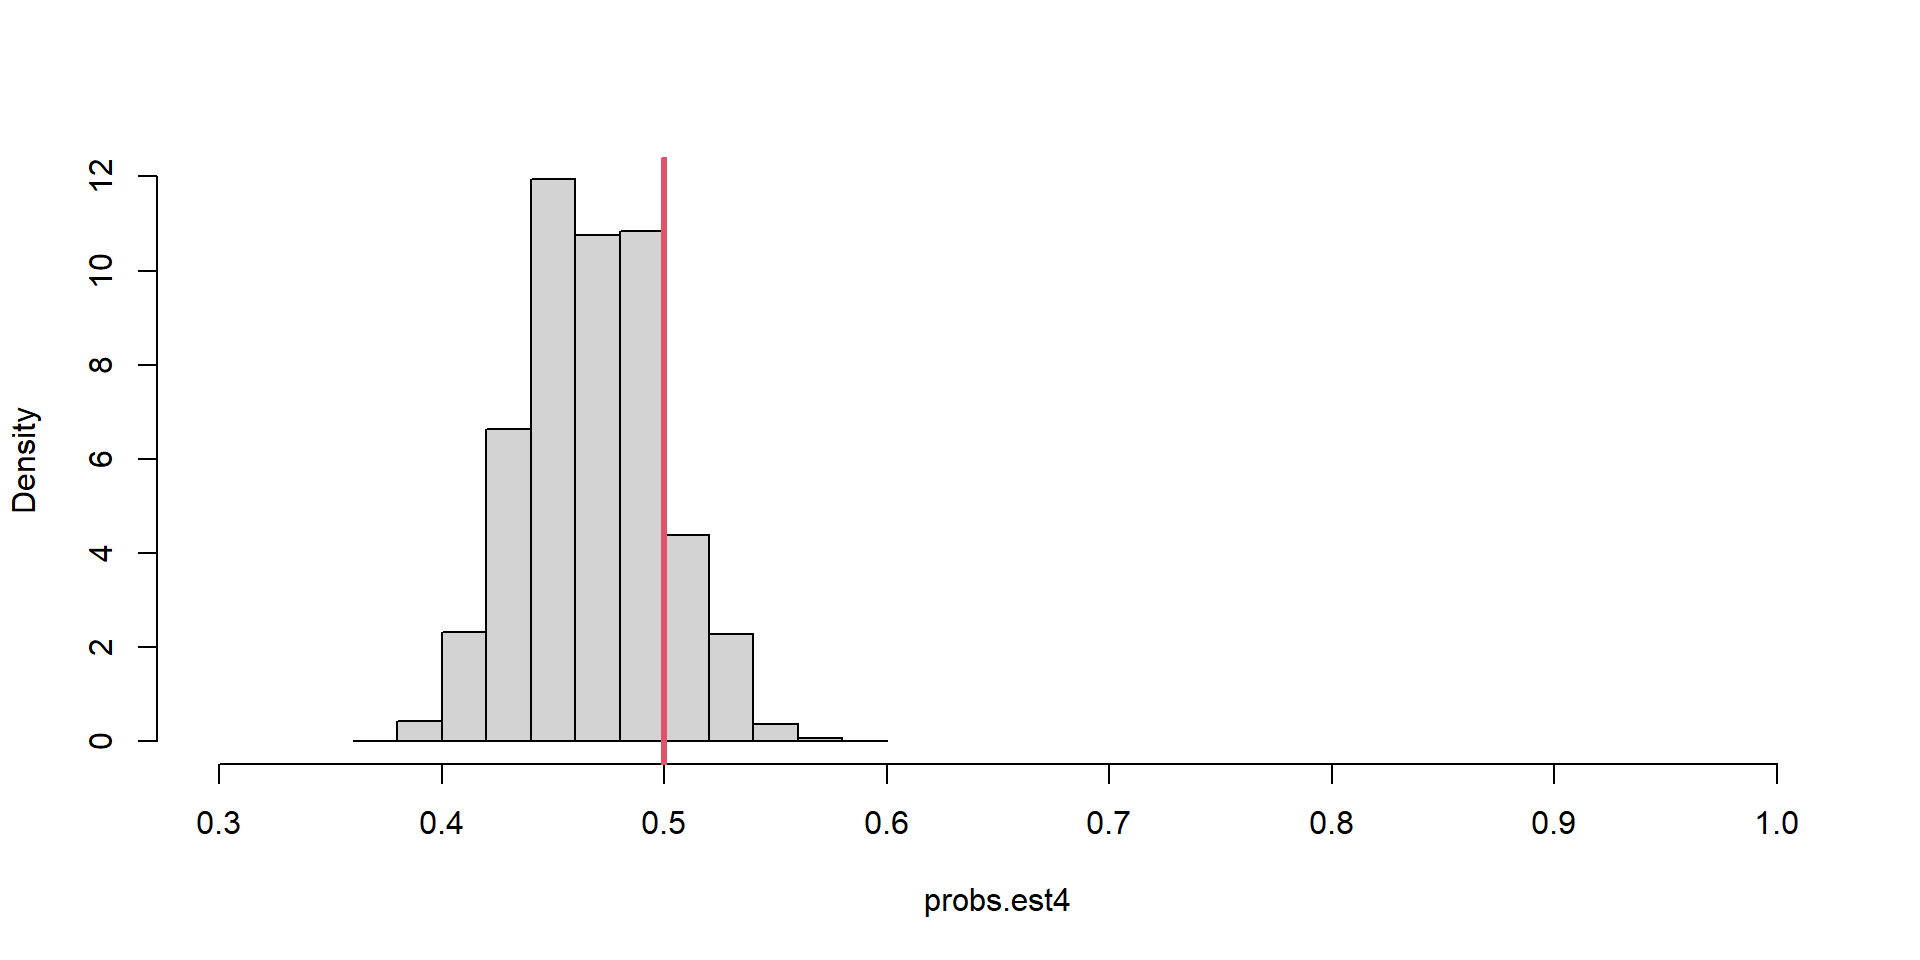
Estimator Bias = -0.03147
“not precisely unbiased” - Thompson